C.F. DRURY¹ , C.S. TAN¹ , W.D. REYNOLDS¹ , C.A. FOX¹ , N.B. MCLAUGHLIN² , and S. BITTMAN³
Agriculture and Agri-Food Canada ¹ Harrow, Ontario, ² Ottawa, Ontario, ³ Agassiz, British Columbia
Tillage has been used over the centuries to control weeds, to incorporate previous crop residues, and to prepare the seedbed. The optimum choice of tillage practice is determined by tillage economics and the amount and timing of precipitation, the topography of the field, soil type and crops being grown each year and in rotation. The economics of tillage selection is a balance between the additional costs of the tillage operations versus the additional revenue of the improved yield and quality of the crop. Unfortunately, tillage can also have negative environmental impacts related to increased soil erosion and surface water runoff, loss of soil organic matter, pollution of surface and ground water resources by crop chemicals and nutrients, and evolution of ammonia, greenhouse gases and odours. These negative environmental effects can in turn produce negative economic impacts, especially when large areas or long time periods are involved.
Classes of cultivation
The many methods of tillage have been classified in a variety of ways. The trend is to consider cultivation as “conventional” when there is substantial disturbance of the soil surface and crop residue. Conventional tillage mixes the residues from the previous crop throughout the top 15-25 cm (6-10 in) of the soil. Mouldboard ploughing, a traditional tillage method in many regions, lifts and inverts the top soil (Fig. 1).
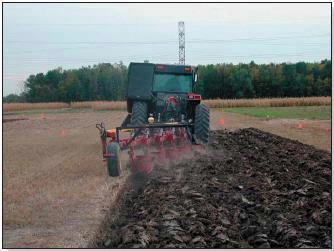
Figure 1. Conventional mouldboard ploughing in southern Ontario
Disking mixes the surface of the soil and residues to varying but relatively shallow depths (7-10 cm or 3-4 in). Chisel ploughing lifts and loosens the soil but unlike mouldboard ploughing, does not invert the soil and plant residue. The chisel plough consists of 10 cm (4 in) wide twisted teeth on shanks spaced 38 cm (15 inch) apart. Ridge tillage systems form the soil into elevated ridges in the fall. The ridges dry faster in the spring so the crop can be planted early into the tops of the ridges. The ridges are reformed when the corn is at the 6-8 leaf stage, similar to hilling of potatoes.
Conservation tillage is a term introduced in the 1980’s and refers to a range of reduced tillage systems with no-till (or zero till) being the extreme. By definition, conservation tillage systems leave 30% or more crop residue cover on the soil surface (1). No-till involves minimal soil disturbance with the crop planted directly into stubble from the previous crop.
Over the past few decades, equipment manufacturers have developed a variety of implements to cultivate narrow strips for planting corn and other row crops, leaving the areas between the strips untilled. In this ‘strip’ or ‘zone’ tillage system, 20-cm (8 in) wide strips are cultivated to a 15-30 cm (6-12 in) depth, usually in the fall, with a tool consisting of a centre shank and a wave coulter on either side of the shank (Fig. 2). Corn is planted into the centre of these tilled zones in the following spring. Zone tillage and no-till leave similar amounts of crop residue on the surface on a per hectare basis, although zone tillage leaves thicker residue between the zones (2).
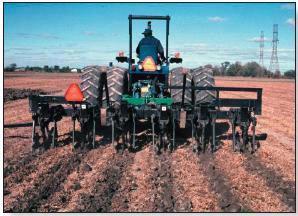
Figure 2. Strip or zone tillage in southern Ontario.
Effect of tillage on soil physical quality
The physical quality of a soil refers to its strength and ability to provide water and air to plant roots. Soil with good physical quality is “strong” enough to maintain good structure, hold crops upright, and resist erosion and compaction, but “weak” enough to allow unrestricted root growth and proliferation of soil flora and fauna. Soil with good physical quality also has fluid (air and water) transmission and storage characteristics that can provide the correct proportions of water, dissolved nutrients and air for both maximum crop performance and minimum environmental degradation (3).
Some useful parameters indicating soil physical quality include bulk density, air capacity, plant-available water capacity, and relative field capacity. Bulk density is an indicator of the soil’s strength and resistance to the growth of crop roots. A soil bulk density that is too high restricts root growth while a bulk density that is too low provides insufficient root-soil contact and water retention for adequate germination and seedling growth. The optimum bulk density for most soils is in the range 0.9-1.2 t/m3 (4). Root growth becomes severely impeded at bulk density values exceeding 1.3-1.6 t/m3 in loam and clay loam soils and 1.6-1.8 t/m3 in sandy soils (5). Note that bulk density of water, referred to as specific density, is 1.0 t/m3 at 4°C (or 39°F). Soil air capacity is a measure of the soil’s ability to store air essential for root respiration; minimum nearsurface air capacity should be about 0.15 m3/m3 (or 15%) (6). Lower air capacity values can result in frequent aeration deficits in the root zone. Plant-available water capacity is a measure of the soil’s ability to store water that can be taken up by crop roots. Soil susceptibility to “droughtiness” increases substantially as plant-available water capacity decreases below 0.2-0.3 m3/m3 (6, 7). The optimal balance between soil water content and soil aeration for crop growth is achieved at a relative field capacity of 0.66, which indicates that 66% of the soil pore space is water-filled and 34% is air-filled (8). This ratio also favours microbial release of plant-available nitrogen (3, 4).
How does conventional cropping (grain corn and soybean rotation) and tillage affect the physical properties of the surface soil layer? We studied temporal changes due to cropping and tillage on Brookston clay loam at Harrow, Ontario by comparing virgin soil, soil in long-term (14 yr) bluegrass (Poa spp.) sod, and soil under 1-, 2-, 3- and 14 yr (long-term) of conventional mouldboard plough tillage. Each successive year of conventional tillage after bluegrass tended to systematically increase bulk density and relative field capacity (Fig. 3). By the third year of conventional tillage, bulk density and relative field capacity had approached values similar to those of longterm conventional tillage. Values for air capacity and plantavailable water capacity followed an approximately inverse pattern to bulk density and relative field capacity (not shown). Even long-term bluegrass sod tended to decrease air capacity and plant-available water capacity below values for virgin clay loam. This study suggests that changes in cropping and tillage can produce rapid and substantial reductions in the near-surface physical quality of a clay loam soil. After only three years of conventional cropping and tillage, all soil physical quality parameters were sub-optimal and generally similar to those of long-term practices.
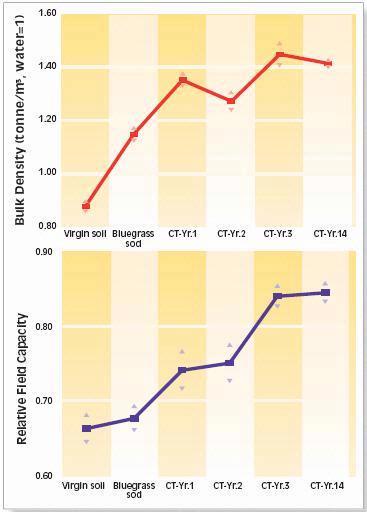
Figure 3. Bulk density (top) and relative field capacity (bottom) of Brookston clay loam soil under virgin conditions, long-term bluegrass sod, and conventional till (corn-soybean rotation) for 1, 2, 3 and 14 yr after bluegrass. The triangles indicate standard error.
The long-term impacts of cropping and contrasting tillage systems on near-surface soil physical quality were investigated on three different soils:
- “structureless”, single-grain Fox sand (90% sand, 5% silt, 5% clay in top 30 cm),
- “structured” Guelph loam (36% sand, 48% silt, 16% clay in top 30 cm)
- “cracking” Brookston clay loam (28% sand, 35% silt, 37% clay in top 30 cm).
Land management consisted of long-term (14 yr) conventional tillage cropping, long-term (7 yr) no-tillage cropping, and virgin woodlot which had never been cropped or tilled. Conventional tillage consisted of mouldboard ploughing in the spring (Fox sand and Guelph loam) or fall (Brookston clay loam) and secondary tillage (disking and harrowing) immediately before planting. No-till used a standard no-till planter, the planting operation producing the only soil disturbance. The cropping sequence was corn-soybean-winter wheat on the Fox sand and Guelph loam, and corn-soybean on the Brookston clay loam.
The measured bulk density values for all three soil types fell within the optimum range for the virgin soil, but above the optimum range for both tillage systems (Table 1). Minimal impedance of root growth would be expected in the Fox sand but moderate to substantial impedance would be expected in the Guelph loam and Brookston clay loam. Tillage system did not affect bulk density of either the clay loam or sand soils, but the loam soil had a lower bulk density under no-till than conventional till.
The air capacity was greatest under virgin conditions and above the minimum for root growth in all three soils (Table 1). Air capacity was reduced by both tillage systems, but remained above minimum in the Fox sand but below the minimum in the Brookston clay loam and Guelph loam. Air capacity was similar for the tillage treatments in all three soils.
Table 1. Impacts of long-term cropping using no-tillage and mouldboard plough tillage on soil physical quality parameters.
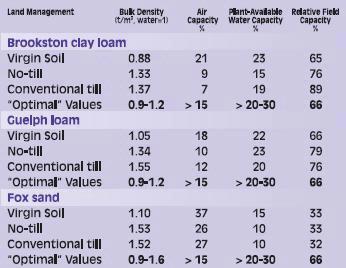
The plant-available water capacity was reasonably similar and near optimum for all treatments on both loam and clay loam (Table 6). However, for the sandy soil, plant-available water capacity was well below optimum for both tillage systems, and slightly below optimum for virgin conditions.
The loam and clay loam soils had near ideal relative field capacity (0.66) under virgin conditions but above-optimum values under both tillage systems (Table 1). In contrast, the sandy soil had below-optimum relative field capacity for all three management systems. Thus, only the virgin loam and the virgin clay loam had optimum soil physical conditions for microbial production of plant-available nitrogen.
This study showed that long-term production of annual crops using both no-till and conventional till reduced the near-surface physical quality of all three soil types. Under virgin conditions, these soils had bulk density, air capacity, plant-available water capacity, and relative field capacity values that are optimal or near-optimal for field crop production. Under long-term cropping, however, bulk density increased in all three soils to above-optimal values that cause moderate to severe restriction of root growth; air capacity decreased to levels where periodic aeration deficits are likely in the loam and clay loam soils; plant-available water capacity decreased to levels that cause slight droughtiness in the clay loam and severe droughtiness in the sand; and relative field capacity increased in the loam and clay loam to values that are not optimal for microbial production of plant-available nitrogen. It is also interesting to note that the negative impacts on soil physical quality were about the same regardless of whether no-till or conventional cropping was used. Therefore the effects of tillage system on near-surface soil physical quality seem to be minor relative to other factors such as soil texture and cropping in general.
Effect on water quantity and quality
Two field-scale on-farm sites at Woodslee in southern Ontario were monitored to compare the impacts of conventional tillage and no-tillage systems on tile drainage volume and losses of nitrate through the tile drains. Over a 5-yr period (1995-1999), the average annual volume of tile drainage was 48% greater for no-till than for conventional tillage (Table 2). Similar results were reported in Ottawa, where tile drains had 46% more flow under no-tillage than conventional tillage treatments (9). Greater preferential flow due to soil macropores caused by earthworms (10) (see below) and better structure (i.e. greater wet aggregate stability, Table 3) contributed to the greater tile drainage volume under no-tillage relative to conventional tillage.
Table 2. Mean tile drainage volume, nitrate-N (N03-N) concentration (flow weighted mean), and N03-N loss (per land area) from a Brrokston clay loam soil under long-term no-till and conventional tillage in southern Ontario (1995-1999)
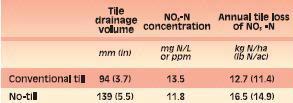
The average nitrate concentration over the 5-year period was 13% lower for no-tillage than for conventional tillage (Table 2). The Canadian guideline value for nitrate in drinking water (10 mg NO3-N/L or ppm) was exceeded in 70% of the tile drainage events from the conventional tillage and in 57 % of the tile drainage events from the no-tillage. The total annual loss of nitrate over a 5-yr period was 30% greater for no-tillage compared to conventional tillage (Table 2). The greater total nitrate loss for no-tillage was primarily due to the larger volumes of tile drainage water lost; the lower nitrate concentrations in the tile drainage water for no-tillage were due to dilution by the larger drainage volumes. Note that the difference in nitrate loss was smaller (30%) than the difference in tile drainage volumes (48%) between these two tillage practices. Increases in nitrate loss with increases in tile drainage volume were found in other studies as well (11, 12). For both no-till and conventional till systems, approximately 80% of tile drainage volume and total nitrate loss in drainage water occurred from November to April when no crop was present to intercept precipitation and make use of water and nitrogen.
Effect on earthworm populations
Minimal disturbance of the soil combined with consistent availability of crop residues as a food source encourages burrowing earthworms and other soil fauna to proliferate in notill systems. Earthworms benefit the soil system (13) by mixing organic materials with soil to form organic-rich aggregates. In the process of mixing soil materials, earthworms also help to redistribute necessary nutrients in the soil profile. Their burrowing activity results in a variety of channels and pores which promote water and air infiltration into the soil (14) and reduce compaction.
Where earthworms have been able to colonize because of favourable climate and soil conditions, earthworm populations are affected by management and land use practices, in particular by (13):
- the amount and duration that crop residues or amendments (manures or composts) remain on the soil surface;
- the duration and intensity of mechanical disturbance from tillage operations.
For example, conventional mouldboard plough tillage decreases earthworm food source by distributing crop residues throughout the plough layer, which both reduces accessibility of the residues to earthworms and promotes more rapid consumption of the residues by soil microorganisms (15). No-till, on the other hand, maintains crop residues on the soil surface where they are highly accessible to earthworms but largely unavailable to soil microorganisms. Intense mechanical tillage, especially mouldboard ploughing, reduces earthworm populations by direct dismemberment, by destruction of burrow networks, and by burying earthworm cocoons too deeply in the soil to hatch.
Figure 4 shows the influence of type of tillage practice on earthworm population numbers. The long-term no-till site (established in 1983) had a mean population of 89 worms/m2 (approximately 89/10 ft2) (range of 43 to 170). Mean population numbers for ridge tillage (50 worms/m2 or /10 ft2) was lower than no tillage but higher than conventional tillage (14 worms/m2). In a comparison of no-tillage and conventional tillage in a paired watershed (16, 17), the no-tillage site was observed to have over 114% more earthworms (163 earthworms/ m2) than the nearby conventional tilled site (76 earth-worms/m2). Similarly earthworm biomass (weight) was greater in no-tillage vs conventional tillage sites.
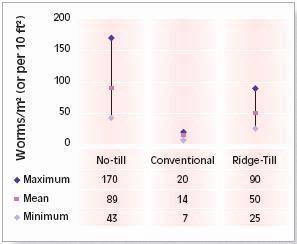
Figure 4. Earthworm abundance observed on a long-term (since 1983) tillage site at Woodslee, Ontario, showing mean and minimum and maximum earthworm numbers/m2 (per 10 ft2) from 1997-2001 (except 2000 when earthworms moved below sampling depth due to severe drought).
Effects on soil temperature, corn emergence and yield
In fine textured soils in humid regions, cool and wet soils in spring delay planting and crop emergence. Soils are kept moist and cool by residues from previous crops such as winter wheat, which may leave up to 5 t/ha (2.3 T/ac) of straw after harvest. Even in loam soils, residues from a previous crop such as wheat may delay emergence. Compared to bare soils, a surface mulch decreased soil temperatures in a loam soil by 2.2°C (4°F) during early corn growth which resulted in delayed corn development (18). In a clay loam soil from 1998 to 2000, no-tillage soils were 1.2°C (2.2°F) cooler at 10 cm (4 in) depth during early growth (planting to the 6- leaf stage) than conventional tillage treatments (2). The notill soils were also wetter (28.5% volumetric water content) in the top 0-30 cm (12 in) depth as compared to conventional tillage soils (24.0% volumetric water content) during this emergence period. The net result was the cooler and wetter no-till clay loam soils resulted in lower corn grain yields (5.33 t/ha or 85 bu/ac) than the corresponding con- ventional tilled soils (7.33 t/ha or 116 bu/ac). However in a sandy loam soil removing the residue in a no-till system increased soil temperature but not necessarily final yields. Hence, it appears that cooler soil temperatures are more of a problem for delayed emergence and reduced yields in fine textured clay and clay loam soils than in coarse textured sandy loam soils.
Corn emergence following winter wheat was delayed by about 3 days with no-till and was only slightly delayed with zone tillage compared to mouldboard plough tillage (Fig. 5). The plants in zone tillage production reached similar populations as the conventional mouldboard plough tillage while no-tillage populations were 28% lower (64% emergence) than with either conventional tillage (89% emergence) or zone tillage (89% emergence).
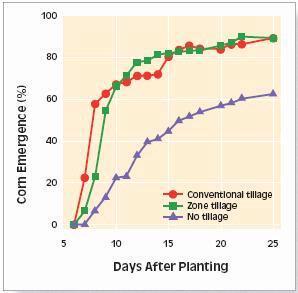
Figure 5. Corn emergence in 1998 following winter wheat; corn was either conventionally tilled, zone tilled or planted into no-till soil.
Effect on long-term yields
The long-term effects of conventional tillage, no-tillage and ridge tillage were evaluated over 20 years on a clay loam soil in Woodslee, Ontario (Fig. 6). Note that continuous corn was grown for the first 14 years of the study, and corn soybean rotation for the last 6 years.
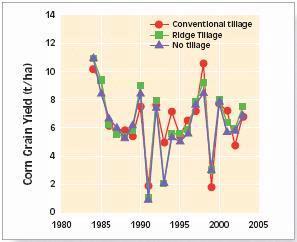
Figure 6. Corn grain yield as affected by conventional tillage, ridge tillage and no-tillage treatments on a clay loam soil at Woodslee, Ontario. The crop rotation was continuous corn from 1983 to 1996 and corn-soybean from 1996 to 2003 with each crop present each year (for bu/ac multiply t/ha by 15.9).
Averaged over 20 years in Ontario, conventional tillage corn grain yield (6,500 kg/ha or 103 bu/ac) was 5.3% greater than no-tillage and 1.4% greater than ridge tillage. Although there was profound year to year variation in yield as a result of weather conditions, there was no obvious yield trend due to the maturation of the soils under the no-tillage treatment. In general, the corn grain yields were similar across all three tillage treatments in moist years when yields were above 6,000 kg/ha (95 bu/ac). However, in 1991 and 1993 when yields were reduced by severe July and August droughts, conventional tillage substantially outperformed conservation tillage (Fig 6).
Effects on soil organic carbon and greenhouse gases
Conventional tillage mixes the residues from the previous crop throughout the top 15-25 cm (6-10 in) of the soil surface. Mixing and aeration of crop residues accelerates their decomposition. The effects of tillage systems (no-till, chisel plough and conventional mouldboard plough tillage) on soil organic carbon levels and distribution was investigated across eight soils in Eastern Canada (19). Under varying soil and climatic conditions, tillage system did not significantly affect total organic C and N storage down to a 60 cm (24 in) depth. However, the distribution of C varied with tillage system; there were high organic carbon contents in the surface layers but lower organic carbon contents at greater depths in no-till compared to conventionally tilled soils. In a long-term study in Ontario, no-tillage soils had much higher carbon contents than conventional tillage soils (3.3% vs 2.4%) in the surface 5 cm (2 in), similar carbon contents at 5-10 cm (2-4 in) layer (2.4% carbon), and considerably lower carbon contents at depths of approximately 10-50 cm (4-20 in) (Fig. 7). There was more carbon stored in the top 0 to 50 cm soil in the conventional tilled soil (160 t carbon/ha) compared to the no-till soil (152 t carbon/ha). Although organic matter decomposition is lower in no-till soils, the lower yield during stress years limits carbon inputs and sequestration in this clay loam soil. Hence, there is a desire to find a conservation tillage treatment in these clay and clay loam soils which has similar yields and plant residue inputs (roots and crop residues) but lower rates of decomposition than conventional tillage.
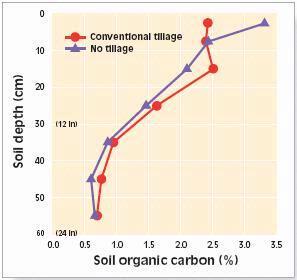
Figure 7. Effect of tillage on soil organic carbon content in the soil profile in a long-term study in southern Ontario.
Ploughed soil with little or no residue cover is more susceptible to erosion by wind and water, contributing to loss of precious top soil and organic matter. It is estimated that years of cultivation have decreased organic matter in Canadian agricultural soils by 15-30% since cultivation (20).
No-tillage was found to reduce emissions of the potent greenhouse gas, nitrous oxide, by 19 per cent while zone tillage lowered emissions by 38 per cent compared to conventional tillage (Fig. 8).
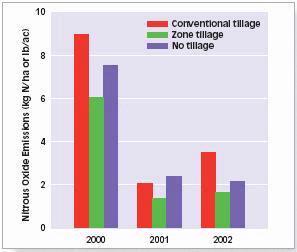
Figure 8. Nitrous oxide losses from soil with conventional tillage, zone tillage and no-tillage treatments. The emission were measured during the corn phase of the wheat-cornsoybean rotation.
Effect on energy consumption
A six -year study (1996 – 2002) on Brookston clay at Woodslee ON compared corn grown in a 3-yr winter wheatcorn- soybean rotation on soils which were either conventionally tilled, zone tilled or were under no-tillage. The tillage treatments for corn following a crop of winter wheat consisted of fall mouldboard plough at 15 cm (6 in) depth; fall zone-till at 15 cm depth (6 in) depth and 20 cm (8 in) width. This study examined corn emergence, corn grain yields, soil physical properties, and emissions of greenhouse gas (nitrous oxide and carbon dioxide). Six-year corn yield averages were 23% lower using no-till and only 6.6% lower in zone tillage compared to the conventional mouldboard plough tillage plots (Fig. 9).
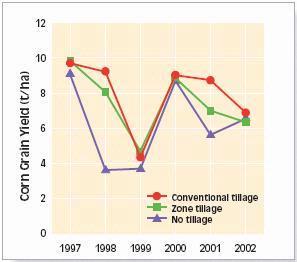
Figure 9. Corn grain yields over 6 years following winter wheat that was either conventionally tilled, zone tilled or was planted into no till soil (for bu/ac multiply t/ha by 15.9).
The yield reductions in zone tillage occurred primarily in 1998 and 2001, the two years which had severe drought conditions during the growing season (2). The decrease in revenue with zone tillage from these lower yields are partially offset by the reduction in fuel consumption and reduced labour costs with zone tillage compared to conventional mouldboard plough tillage.
Conventional mouldboard plough tillage required 20.4 L/ha (2.2 gal/ac) fuel for ploughing as compared to 6.7 L/ha (0.7 gal/ac) for zone tillage (Table 4). Hence zone tillage reduced fuel consumption by 67% (20.4 to 6.7 L/ha or 2.2 to 0.7 gal/ ac) compared to conventional mouldboard plough tillage, because less soil was tilled (i.e 27% of the soil surface is cultivated with zone tillage compared to 100% with conventional mouldboard plough tillage). In terms of drawbar energy, conventional tillage required 99.4 MJ/ha (262 hp-h/ac) to perform the tillage operation whereas zone tillage only required 49.5 MJ/ha (129 hp-h/ac) or a 50% reduction in energy requirements. If the tractor and implement sizes were properly matched, the fuel savings would be approximately the same percentage as the drawbar energy. The reason we found a 67% savings in fuel, and only 50% savings in drawbar energy for zone till over conventional mouldboard plough was that the tractor was overpowered for the mouldboard plough; we should have used a larger plough or a smaller tractor. The different ratios of drawbar energy and fuel consumption for zone tillage and mouldboard plough clearly illustrate how fuel can be wasted with improper tractor-implement match, ie, tractor too large for the implement.
The fuel and energy inputs in Table 4 are only for fall tillage; energy inputs for spring cultivation were not measured. Even greater differences for fuel and energy inputs would be expected when spring operations are considered since planting is done directly into the tilled zones, while mouldboard ploughed soil usually requires two or three spring tillage operations prior to planting.
Table 4. Fuel consumption and draw bar energy in the fall following winter wheat harvest for conventional tillage, zone tillage.

|
SUMMARY |
|||
|
Comparison of Tillage System |
|||
|
Effect |
Conventional |
No-till |
Zone or Strip Till |
| Improve structure | moderate to poor | good | good |
| Accelerate soil drying | good | poor | slight |
| increase water infiltration | moderate | good | good |
| reduce erosion/runoff | poor | good | good |
| increase soil temperature | good | poor | variable |
| increase crop yield | good | variable | good |
| incorporate residues | good | poor | slight |
| reduce greenhouse gases | poor | good | good |
| kill weeds | good | Poor (immediately) | slight |
| reduce plant diseases | good | poor | slight |
| reduce fuel & labour costs | poor | very poor | good |
References
1. Gregorich, E.G., L.W. Turchenek, M.R. Carter and D.A. Anger 2001. Soil and Environmental Science Dictionary. CRC Press, Boca Raton Florida.
2. Drury, C.F., C.S. Tan, W.D. Reynolds, T.W. Welacky, S.E. Weaver, A.S. Hamill and T.J. Vyn 2003. Impacts of zone tillage and red clover on corn performance and soil quality. Soil Sci. Soc. Am. J. 67, 867-877.
3. Reynolds, W.D., B.T. Bowman, C.F. Drury, C.S. Tan and X. Lu 2002. Indicators of good soil physical quality: density and storage parameters. Geoderma 110, 131-146
4. Olness, A., C.E. Clapp, R. Liu and A.J. Palazzo 1998. Biosolids and their effects on soil properties. P. 141-165. In: A. Wallace and R.E. Terry (eds.), Handbook of Soil Conditioners. Marcel Dekker, New York, NY.
5. Jones, C.A. 1983. Effect of soil texture on critical bulk densities for root growth. Soil Sci. Soc. Am. J. 47, 1208-1211.
6. Cockroft, B. and K.A. Olsson 1997. Case study of soil quality in south-eastern Australia: management of structure for roots in duplex soils. pp. 339-350 in E.G. Gregorich and M.R. Carter (eds.), Soil Quality for Crop Production and Ecosystem Health. Elsevier, New York, NY.
7. Verdonck, O., R. Penninck and M. De Boodt 1983. Physical properties of different horticultural substrates. Acta Hortica 150, 155-160.
8. Skopp, J., M.D. Jawson and J.W. Doran 1990. Steady-state aerobic microbial activity as a function of soil water content. Soil Sci. Soc. Am. J. 54, 1619- 1625.
9. Patni, N.K., L. Masse and P.Y. Jui 1996. Tile effluent quality and chemical losses under conventional and no tillage – Part 1: Flow and nitrate. Transactions ASAE: 39 (5), 1665-1672.
10. Ehlers, W. 1975. Observation on earthworm channels and infiltration on tilled and untilled loess soil. Soil Sci. 119, 242-248.
11. Tan, C.S., C.F. Drury, J.D. Gaynor and T.W. Welacky 1993. Integrated soil, crop and water management system to abate herbicide and nitrate contamination of the Great Lakes. Water Sci. Technol. 28, 497-507.
12. Drury, C.F., C.S. Tan, J.D. Gaynor, T.O. Oloya and T.W. Welacky 1996. Influence of controlled drainage-subirrigation on surface and tile drainage nitrate loss. J. Environ. Qual. 25, 317-324.
13. Tomlin, A. and C.A. Fox 2003. Earthworms and agricultural systems: Status of knowledge and research in Canada Can. J. Soil Sci. 83, 265-278.
14. Shipitalo, M.J. and K.R. Butt 1999. Occupancy and geometrical properties of Lumbricus terrestris L. burrows affecting infiltration. Pedobiologia 43, 782- 794.
15. Fox, C.A. 2003. Characterizing soil biota in Canadian agroecosystems: State of knowledge in relation to soil organic matter. Can. J. Soil Sci. 83, 245-257.
16. Tan, C.S., C.F. Drury, M. Soultani, I.J. van Wesenbeeck, H.Y.F. Ng, J.D. Gaynor and T.W. Welacky 1998. Effect of controlled drainage and tillage on soil structure and tile drainage nitrate loss at field scale. Water Sci. & Technology 38, 103-110.
17. Tan, C.S., C.F. Drury, W.D. Reynolds, J.D. Gaynor, T.Q. Zhang and H.Y. Ng 2002. Effect of long-term conventional tillage and no-tillage systems on soil and water quality at the field scale Water Sci. & Technology 46, 183-190.
18. Fortin, M.C. and F.J. Pierce 1990. Developmental and growth effects of crop residues on corn. Agron. J. 82, 710-715.
19. Angers, D.A., M.A. Bolinder, M.R. Carter, E.G. Gregorich, C.F. Drury, B.C. Liang, R.P. Voroney, R.R. Simard, R.G. Donald, R.P. Beyaert, and J. Martel 1997. Impact of tillage practices on organic carbon and nitrogen in cool, humid soils of Eastern Canada. Soil Tillage Res. 41, 191-201.
20. Gregorich, E.G., D.A. Angers, C.A. Campbell, M.R. Carter, C.F. Drury, B.H. Ellert, P.H. Groenvelt, D.A. Holmstrom, C.M. Monreal, H.W. Rees, R.P. Voroney and T.J. Vyn 1995. Changes in soil organic matter. pp. 41-50 in D.F. Acton and L.J. Gregorich (eds) The health of our soils: Toward sustainable agriculture in Canada. Centre for Land and Biological Resources Research, Research Branch, Agriculture and Agri-Food Canada, Ottawa, Ontario.
Does no-till cool silage-corn soil under high rainfall?
D.E Hunt and S. Bittman
Agriculture and Agri-Food Canada, Agassiz, British Columbia
Crop residues shade the soil and keep it moist. Tillage increases contact of soil and air and buries crop residue, thereby helping to dry and warm the soil. Since there is little crop residue in successive crops of silage corn, tillage would be expected to have less impact on soil temperature in silage than in grain corn. Frequent spring rainfalls in coastal BC repeatedly rewet the soil so that tillage may do little to dry out the soil directly. We measured soil temperature on tilled and untilled soil planted to silage corn on several farm fields in coastal BC. The soils ranged from fairly sandy to fairly clayey. We found that when the soil temperature was below 13°C (55°F), there was little difference in temperature between tilled and untilled soil. Above this temperature, tilled soil warmed about 10% faster than untilled soil. As expected, the temperature difference was greatest in rain-free periods, which were more common when the soil was warm.
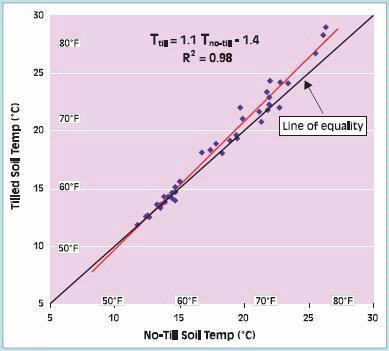
Figure 1. Relationship between temperature of till and no-till soil at 5 cm (2 in) depth for silage corn grown on 10 farm fields in coastal BC.
G. STEWART
Ontario Ministry of Agriculture and Food, Guelph, Ontario
1. Soil drainage
Successful reduced tillage systems for corn must have either good natural drainage or systematic tile drainage. Good internal drainage improves the probability that soils in a notill system will dry and allow for timely planting of corn. Drainage also lessens the risk that soils will become saturated which causes poor root growth and activity, especially early in the season. Producers often discover that no-till is difficult in fine textured soils that are not systematically tile drained.
2. Crop Rotation
The essential message is that “rotations replace tillage”. Continuous corn and narrow rotations do not lend themselves to no-till regardless of what else is done correctly. Crop rotations with a diversity of crops, especially legumes and forages, improve soil structure and help make no-till more successful (Fig. 1).
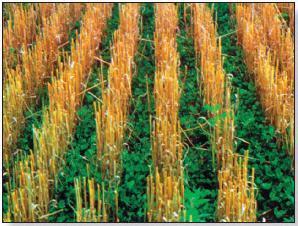
Figure 1. Reduced tillage is often more successful when crop rotations are diversified and soil structure is enhanced.
3. Residue management
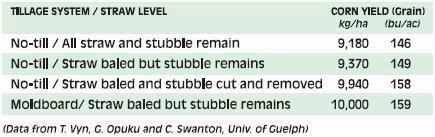
Balancing the goals of reducing tillage costs for corn, improving net profits, and enhancing the long-term health of the soil requires corn producers to make decisions about how best to handle crop residues, particularly wheat straw. To facilitate no-till or reduced tillage corn production, it is best to remove the wheat straw from the field (Table 1). Removing straw from fields, especially in high yielding wheat crops and on heavier textured soils increases the potential for no-till corn yields to equal those of mouldboard ploughing.
Table 1. The Effect of wheat straw levels on no-till corn yields at Wyoming, Ontario in 1994-1996. Un-cut stubble was approximately 25-30 cm (10-12 inches) high.
Where removal of straw from the previous crop is not possible, uniform spreading of the straw and chaff is critical for no-till or reduced tillage success. Even if straw is to be left in the windrow, it is important to spread the chaff as widely and uniformly as possible during combining. Straw choppers on the combine may be useful. In cool wet springs, low soil temperatures, poor growth and potential slug damage brought on by mats of decaying wheat residue often result in yield losses that might have been avoided by uniform residue spreading.
Where the risks of water and wind erosion are high, the benefits of returning all the straw to the soil might outweigh the advantages of reducing tillage. For farms with high erosion risk, reduced tillage systems, even with the need to remove some straw, are probably more sustainable. Another option is to compromise. This will require some light tillage to partially incorporate straw while leaving the soil surface largely protected.
4. Weed Control
For corn yield potential to be realized in no-till cropping systems, optimum weed control is required. Pre-plant burndown of weeds in the spring is critical to allow the crop to develop without interference during vulnerable early growth stages. Weed management will need to target perennial weeds and some new weed invaders, i.e. shift in weed population. (See Weed Control section).
5. Starter Fertilizer (P and K)
Studies in Ontario indicate that nutrient stratification (nutrients concentrated near the soil surface) may occur in long term no-till fields. Without the option to incorporate or mix dry fertilizer material in the no-till system, fertilizer placement is particularly important. Results have shown that the size of the yield response to planter-banded K in no-till often exceeds the response on mouldboard plots. Often the best money spent in setting up a corn planter for no-till is the purchase of no-till, single disk, fertilizer openers that can deliver the fertilizer in all conditions to the right depth without having to bolt on additional coulters (see Fig. 2).
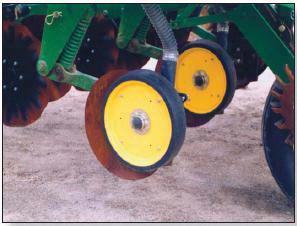
Figure 2. Single disk, no-till fertilizer openers can provide excellent dry fertilizer placement in no-till situations.
6. Early Season Nitrogen Supply
Another important factor to consider is that no-till soils are often cooler and less aerated than tilled soils. These conditions decrease nitrogen mineralization so that less N is available to the crop early in the season. Failing to apply sufficient N fertilizer at planting time when the remainder of N fertilizer is to be sidedressed may limit yield of no-till corn. A good rule of thumb is to apply 35 kg/ha (30 lbs/ac) of starter N with the no-till corn planter (Fig. 3).
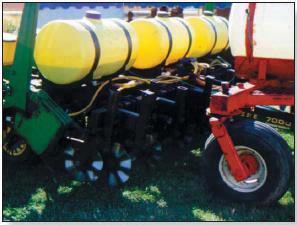
Figure 3. Some no-till planting systems have been modified to deliver some or all of the nitrogen during the planting operation.
7. Soil Compaction
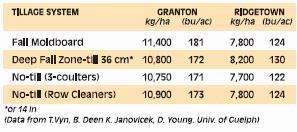
Soil compaction is often cited as one of the reasons that no-till systems may yield less corn than conventional tillage systems. An option for lowering soil compaction in reduced tillage systems is to loosen some of the soil that is below the seeding depth. This can be done in autumn without disrupting much of the crop residue on the soil surface by confining the operation to zones (strips) where the corn rows will be planted (see Fig. 4). Trials conducted by University of Guelph illustrated that deep in-row loosening generally provided insufficient yield benefit (compared to strict no-till) to pay for the cost of the additional field operation (Table 2). Some growers have claimed benefits of deep ripping on poorly drained areas or in areas such as headlands where soil compaction was excessive.
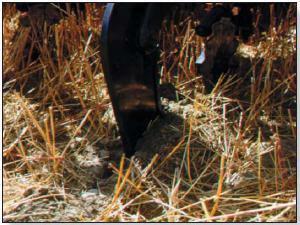
Figure 4. Deep in-row ripping in the fall prior to reduced tillage planting in the spring.
Table 2. The effects of tillage systems on corn yields following winter wheat at Granton, Ontario (loam to clay-loam soil) and Ridgetown, Ontario (clay-loam soil) (Average of 1998-2000)
8. Strip Tillage
Confining fall tillage to narrow zones used for planting corn in the spring is a concept which has received considerable attention over the past few years. The idea is to prepare strips of soil in the fall that are loosened, cleared of residue and hopefully somewhat elevated while leaving the rest of the field covered with residue and protected (see Fig. 5). These strips are drier, less dense and more suited to single pass corn planting in the spring.
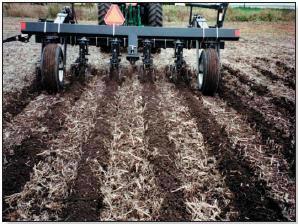
Figure 5. The effect of tillage system on soil moisture levels in the seed zone (0-15 cm deep) in the early May period (sampling dates ranged from May 1 – 5 May, 2002)
Our ongoing research in Ontario has allowed us to continue to study equipment and practices for fall strip tillage. We are now confident that equipment available to Ontario growers can create uniform, elevated strips in the fall with minor adjustments or additions. The enhanced performance of the strip tillage equipment continues to be reflected in superior spring seedbed conditions.
One of the motivations for strip tillage is to avoid the delay in planting that is often associated with no-till systems, par- ticularly on the medium to fine textured soils. Field scale research continues to demonstrate massive support for the idea that a properly formed berm or strip in the fall can significantly improve soil dry-down and hence planting timeliness (Fig. 6).
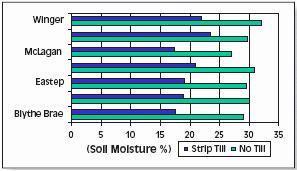
Figure 6. Fall strip tillage creating residue-free zones that will improve planting timeliness the following spring.
N.B. MCLAUGHLIN, D.R. LAPEN, D. KROETSCH, X. WANG, E.G. GREGORICH, B.L. MA AND Y.X. LI
Agriculture and Agri-Food Canada, Ottawa, Ontario
Good soil management creates a favorable environment for healthy root growth. High soil strength can inhibit the penetration of roots, resulting in poor plant growth. Excess soil strength can occur naturally as soil with high clay or low organic matter hardens in droughty conditions, a process called ‘age-hardening’ or ‘hard-setting’. Soil compaction also increases soil strength and impedes root penetration.
Soil compaction is the consolidation of soil particles into close proximity with each other. This not only increases soil strength but also reduces pore volume, soil aeration and natural drainage. Wheel traffic on fields compacts the soil increasing soil strength and reducing yields by 20 to 30% depending on the severity of compaction, soil texture, soil conditions at planting, and weather during the growing season. Full season crops such as corn require field operations in early spring and late fall when the soil is often wet and vulnerable to compaction so producers often face difficult management decisions.
Fine textured soils with high clay and silt content and with low organic matter are especially prone to compaction. Water films around soil particles act like a lubricant allowing the soil particles to slide by each other into a compacted state when loaded with a heavy wheel. There is an intermediate range of water content where the greatest compaction damage occurs. Road builders intentionally wet the road surface to achieve the water content where greatest degree of aggregate compaction can be achieved. Wheel traffic in very wet conditions can surface seal (crust) the soil which is an added problem.
Surface Compaction
Soil compaction is sometimes classified as surface and subsurface. Surface compaction is usually caused by high contact pressure between the wheel and the soil surface, and is related to the tire inflation pressure. Surface compaction is visually evident as a smooth shiny surface of wheel tracks due to reduced pore space, and water laying in the wheel tracks due to reduced natural drainage (Fig. 1). Large hard clods on the soil surface following tillage also indicates surface compaction. Tillage can help break up surface compaction in a conventional tillage system, but this is not an option in a no-till system. Freeze-thaw cycles in spring and fall and use of forage crops in a rotation naturally loosen compacted soil. Surface compaction can be reduced by reducing traffic, using lighter machines, using dual wheels and larger tire sizes and reducing tire inflation pressure. Modern radial tires can usually be run at lower inflation pressures than bias ply tires. Manufacturers’ recommendations should be consulted for the correct inflation pressure for a given axle weight.
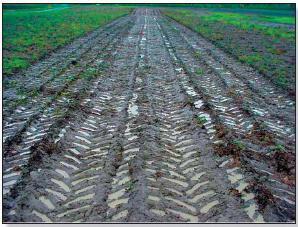
Figure 1. Soil trafficked after heavy rain; despite minimal rutting, infiltration has been reduced, with some water lying in the wheel tracks. The shiny soil surface indicates reduced pore space.
Subsurface Compaction
Subsurface compaction, often called a plough pan, is usually more problematic than surface compaction since it is not easily detected and is not corrected by natural freezethaw cycles. It is caused both by tillage and by traffic with heavy field machinery. A tillage tool passing through the soil compresses the soil in a roughly spherical zone above and immediately below the leading edge of the tillage tool. This compression causes the soil to break up or fragment, which is the desired effect of tillage. However, there is little opportunity for fracture planes to develop in the zone immediately below the tillage tool, so the soil remains in a compressed or compacted state. This compressed zone is called a “plough pan” because it is located immediately below the tillage depth, and because it was first identified in mouldboard ploughed fields. Repeated tillage operations over several years can contribute to both the formation and downward extension of a plough pan.
Compressive stresses from heavy axle loads can compact the soil to depths well below normal tillage depth. While reducing tire inflation may help to reduce surface compaction, reducing subsurface compaction must take into account total axle weight. Very heavy equipment such as grain buggies and liquid manure spreaders are especially problematic; hence confining grain buggies to headlands and applying liquid manure with drag hoses can help reduce compaction. A Swedish study found that the costs of soil compaction from manure spreading may be as large as the value of the plant nutrients in the manure.
Identifying Subsurface Compaction
Subsurface soil compaction is more difficult to detect than surface compaction. Poor crop performance and water ponding due to poor drainage may indicate underlying compaction. Plant roots can be exposed and the pattern of root growth observed by carefully removing soil from the walls of a pit. Roots take the path of least resistance, traveling horizontally along the periphery of compacted zones (Fig. 2 left) compared to the vertical movement for non-compacted soil (Fig. 2 right). Sometimes, roots will follow a crack in the soil fanning out within the crack (Fig. 3), because they are unable to penetrate compacted soil and reach water and nutrients beyond the crack.
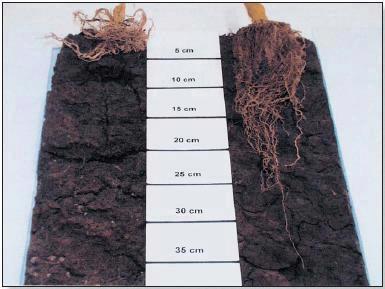
Figure 2. Corn roots in compacted (left) and non-compacted (right) heavy clay soil from an experiment in Australia. Roots were not able to penetrate the compacted layer so growth was stunted.
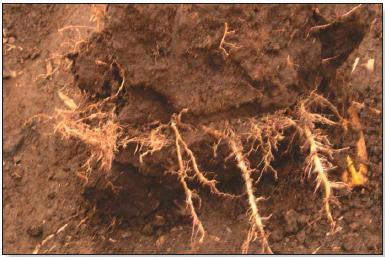
Figure 3. Corn roots following a crack in compacted soil; the roots have fanned out in two dimensions within the crack, but have not penetrated the hard soil on either side of the crack.
Preventing and Remediating Soil Compaction
Soil compaction can be best prevented by staying off wet fields. Subsurface drains and contouring promote drainage helping the soil dry out.
Tire inflation pressure may be lowered as this spreads the axle load over a larger surface area. Tire manufacturers literature should be consulted to determine the proper tire inflation pressure.
Always driving over the same tracks (tramlines) reduces overall field compaction. This is especially effective when all field implements have the same working widths (preferably large). Because the suppressed growth strips are narrow, plants growing adjacent to the compacted tramlines will have access to additional light, water and nutrients, hence produce compensatory growth.
Deep tillage is often suggested as a method of breaking up plough pans. However, this operation is expensive, not always successful and may even cause additional damage in wet soils. Deep tillage is likely to be most effective if performed when the soil is very dry in late summer after harvest of a cereal or forage crop. It may be best to try deep tillage in a small test area known to have a subsurface compaction problem.
Compaction Demonstration Experiment
A compaction experiment was conducted in 2002 and 2003 at the Central Experimental Farm (CEF) in Ottawa to examine the effects of untimely field traffic. The objective was to determine the impact of wheel traffic compaction, such as might occur as a result of early spring spreading of liquid manure on wet soil, on the germination, growth and yield of corn. After compaction, the field plots were cultivated, fertilized and planted using normal procedures for the region.
Compaction reduced corn plant establishment and plant height in both years. In 2002, compacted plots yielded 8.0 t/ ha (127 bu/ac) compared to 8.4 t/ha (134 bu/ac) for the noncompacted plots. In 2003, compaction reduced yields by 3.1 t/ha (49 bu/ac). Field plots compacted in 2002 continued to reduce yields in 2003. The non-compacted plots also responded better to fertilizer. These results clearly demonstrate the damage that can be done by driving on fields when they are too wet.
By excavating the soil and carefully exposing roots we found that roots in the compacted strip (Fig. 5 right) exhibited much less branching than those in the non-compacted strip (Fig. 5 left). As in Fig. 3 above, roots in the compacted areas tended to follow cracks, fanning out in two dimensions within the crack.
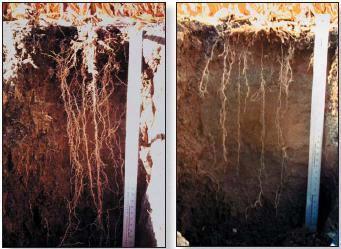
Figure 5. Corn roots in non-compacted (left) and compacted (right) soil; note the difference in branching of the corn roots.
Testing Soil Strength
Soil strength can be measured with a cone penetrometer which measures the force required to push into the soil, a probe fitted with a standard 12.7 mm (0.5 inch) diameter, 30 degree conical tip. In a sense, the penetrometer mimics a root pushing its way into the soil. Compaction testers consisting of a probe and a dial gage to indicate penetration force are commercially available for on-farm use. A simple manual probe can be made from a one meter (40″) length of 9.5 mm (3/8″) stainless steel rod, fitted with a conical tip, and a T-handle (Fig. 4). The tip can be made by first building up the surface of the rod end with a weld bead, and then machining or grinding it to a conical shape. By comparing the effort required to push the probe into known compacted areas (such as headlands) to un-compacted areas (such as fence lines), one can quickly develop a “feel” for degree and extent of soil compaction.
Soil strength is measured in units of pressure: 1 Mega Pascal (MPa) = 145 lb per square in (psi). Root growth is reduced by about half at a penetration resistance of 2.0 MPa (290psi) and severely limited at 3.0 MPa (435 psi). The 2.0 MPa threshold is equivalent to a force of about 26 kg (57 lb) to push the 0.5 inch diameter probe into the soil; penetration resistance in compacted soils can be two to four times this value. Higher soil water content typically results in lower penetrometer values so assessments should be carried out at consistent soil water contents.
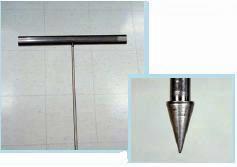
Figure 4. Simple probe with conical tip and T-handle for investigating subsurface soil compaction.