J. Oenema and J. Verloop
Plant Research International, Wageningen, the Netherlands
In the Netherlands, inputs of nutrients on dairy farms via fertilizers, legumes and purchased feed by far exceed the outputs in milk and meat. Eventually, the excess nutrients are emitted to the environment, a problem which is especially acute in sandy regions. Government policy aims at reducing these losses to ‘acceptable’ levels. Research is being carried out in a model dairy farm called ‘De Marke’, located in the eastern sandy area of the Netherlands, to generate information and explore opportunities for reducing losses. The objective of the ‘De Marke’ project is to design and operate an economically viable dairy farming system that meets strict environmental standards, taking into account societal objectives with respect to animal welfare, nature and landscape.
Dairy farming is characterized by the combination of plant and animal production within one farming system. In animal production, part of the nutrients from feed is ‘transformed’ into dairy and meat products while the remainder is excreted in manure. The manure is applied to the field as an input for crop production. The harvested crops are used as feed for the animals, thus closing the cycle. Improved nutrient management through the cycle is characterized by a higher proportion of the nutrients being transferred to products and lower losses to the environment.
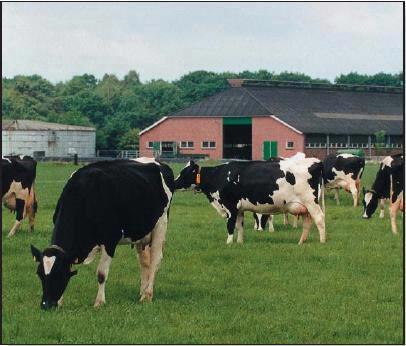
Photo 1 ‘De Marke’ farm in the Netherlands (Wageningen UR).
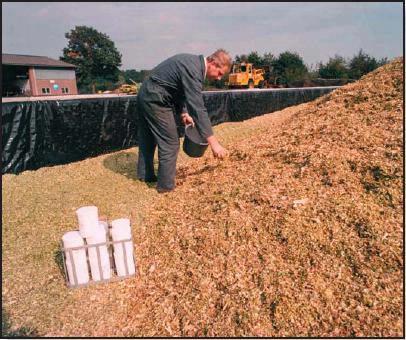
Photo 2 Sampling corn silage at ‘De Marke’ farm in the Netherlands
(Wageningen UR).
Farming System
In order to design a suitable farming system for ‘De Marke’, first input-output relations were quantified, combining process knowledge and expert judgment. For the animal component of the system, this included the relation between milk production and feed requirements (both quantity and quality); for the plant component the relation between crop production on the one hand and nutrient (fertilizer) and water requirements on the other. On the basis of these relations various farm configurations were considered. The most interesting design from the research point of view was implemented in 1992 in the ‘De Marke’ farm. The farming systems on ‘De Marke’ are under continuous development (Table 1).
|
Table 1. Characteristics of crops, animals and farm plan of experimental farm ‘De Marke’. |
|||||
|
|
1993 |
1996 |
1999 |
2002 |
Average ’93-’02 |
|
Milking Cows # |
82 |
77 |
77 |
77 |
78 |
|
Young Stock # |
66 |
58 |
62 |
53 |
57 |
|
Stock density AU/ha (Au/ac) |
1.9(0.8) |
1.7(0.7) |
2.0(0.8) |
1.7(0.8) |
1.8(0.7) |
|
Milk Yield / cow (kg) |
8005 |
8791 |
9175 |
8752 |
8632 |
|
Milk Yield / cow (lb) |
17,611 |
19,340 |
20,185 |
19,254 |
18,990 |
|
Milk fat content % |
4.39 |
4.31 |
4.05 |
4.33 |
4.3 |
|
Milk protein content % |
3.49 |
3.47 |
3.44 |
3.35 |
3.4 |
|
Land Area ha (ac) |
|||||
|
Grass |
30.6(76) |
29.2(72) |
31.9(79) |
31.9(79) |
31.2(77) |
|
Silage corn |
13.1(32) |
20.2(50) |
14.9(36.8) |
9.9(24) |
13.5(33) |
|
Ground ear corn silage |
5.8(14) |
7.1(18) |
5.1(12.6) |
4.7(11.6) |
6.8(17) |
|
Fodder beet |
6.1(15) |
0 |
0 |
0 |
1.5(4) |
|
Triticale silage |
0 |
0 |
0 |
8.4(21) |
2.2(5) |
|
Farm area |
55.6(137) |
56.5(140) |
51.9(128) |
54.9(136) |
55.1(136) |
| *animal unit:milking cow = 1AU; young cow >1 year old = 0.439 AU; young cow < 1 year old = 0.22 AU | |||||
Land Use
The 55 ha (136 ac) of land comprise three parcel types:
- 11 ha (27 ac) of grassland (permanent pasture), located close to the farm buildings
- 30 ha (74 ac) (home parcel) – alternating three years of grassland with three years of corn
- 14 ha (35 ac) (field parcel) – alternating three years of grassland with five years of corn.
The parcels near the barns can be irrigated whereas the field parcel which is farther away from the farm buildings cannot be irrigated. Consequently, grazing intensity is higher on the permanent pasture and the home parcel than on the field parcel. There are several advantages for grass-corn rotation over continuous corn: soil organic matter content is maintained at a higher level than under continuous corn, with positive effects on moisture retention capacity and rooting; fertilizer strategy can be targeted to the rotation; weed problems are mitigated; and yields of corn are on average 10% higher in rotation than under continuous cropping.
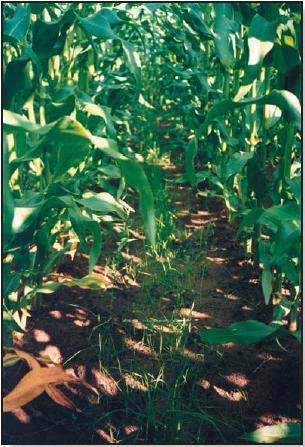
Italian ryegrass planted between corn rows at ‘De Marke’farm in the Netherlands (Wageningen UR)
A little more than half the land area is used for grassland; the remainder is now in use for corn (whole silage and ground ear-corn silage) and triticale silage. The proportion of the land used for corn and triticale is higher at ‘De Marke’ than on most commercial farms on sandy soils in the Netherlands.
Corn silage yields are consistently higher than those of grass (Figs. 1 and 2). Moreover, on the droughtsensitive soils of ‘De Marke’, less irrigation is required for corn than for grass (200 vs. 350 L of water/ kg dry matter or 12 vs. 20 gal/lb dry matter). Hence, a larger proportion of corn both reduces the usage of ground-water for irrigation and the requirements for purchase of feed. Furthermore, a high proportion of (energy-rich and low protein) corn in the feed ration results in lower nutrient contents in manure.
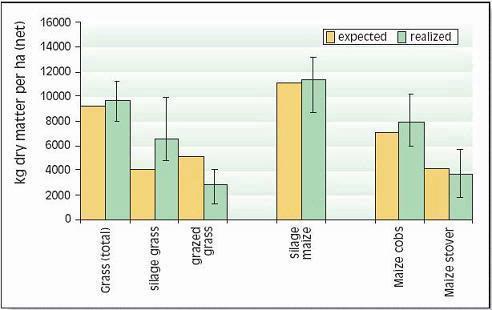
Figure 1. Average net yields of grass (excluding grazing- and harvest losses) and silage corn (kg dry matter per ha) at ‘De Marke’ in the period 1993-2002 (for lb/ac, multiply by 0.9)
Part of the corn crop is harvested as ground ear-corn silage, a product that has proven its value as a substitute for purchased concentrate. The ground ear-corn and the corn stover are harvested at the same time but separately with a specially designed harvester. Because corn stover contains little energy, protein and potassium, but high levels of cell walls which are partly digestible, it is an excellent component (with fall grass silage) for dry cow and pregnant heifer rations.
Since 2000, some corn was replaced with triticale (for silage) under-seeded to a grass/clover mix in the final year of both rotations (Table 1). This change was made because it was felt that triticale would lower nitrate concentration in groundwater relative to corn.
Manure and Fertilizer
Storage, handling and timing of application of manure all aim at maximizing utilization of nutrients by the crop in order to minimize use of chemical fertilizer. For phosphorus, the principle of equilibrium manure application (i.e. total nutrient application in manure should not exceed nutrient export in crops) is used. For the crop rotations, the equilibrium rate is based on a full rotation cycle.
The basic application rates for N are 250 kg/ha (230 lb/ac) for grass and 100 kg/ ha (90 lb/ac) for corn, including the inorganic N in the slurry. Fertilizer rates are determined per field, taking into account the crop, soil moisture-supplying capacity, phosphorus status of the soil and N-supply from ploughed-in sod and green manure. Slurry rates are based on crop N requirements for corn and crop P requirement for grassland. About 80% of all slurry is applied to grassland. Fertilizer application starts on March 1 for grassland and just before sowing (early May) corn.
Cover (relay) Crop
A disadvantage of corn is that its nutrient uptake virtually ceases after the beginning of August. In late summer and autumn, mineralization adds to the soil N that the crop doesn’t take up at this time. To solve this problem, a catch crop of Italian ryegrass is sown between the corn rows, about six weeks after sowing.
Following (early) corn harvest, the ryegrass continues growing and takes up the residual N. Such a catch crop is very effective in reducing environmental impact and is easy to include in farm management.
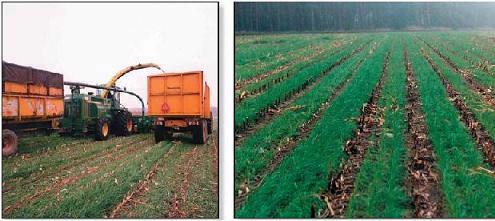
Photo 4 & 5 Harvesting corn underseeded with Italian ryegrass and growth of cover crop in fall at ‘De Marke’ farm in the Netherlands (Wageningen UR)
Yields
Yields of grass and silage corn in the period 1993-2002 were above expectation (Fig. 1) but year-to-year variation was very high (Fig. 2). Corn yields were mainly determined by soil moisture status during grain set. Drought at any other time reduces yield of grass more than corn so low annual grass yields resulting from moisture deficits can coincide with reasonable corn yields. In the years with favorable moisture supply (1993, 1997, 1999, 2000, 2001 and 2002), average grass and corn yields exceeded 10,000 kg/ha. In contrast, spring of 1998 was extremely wet, which resulted in high mineral N losses, especially in corn, and consequently low yields.
Yields of the ground ear-corn silage were higher than expected, and those of stover lower, but stover yields have increased in recent years since the performance of the harvester was improved.
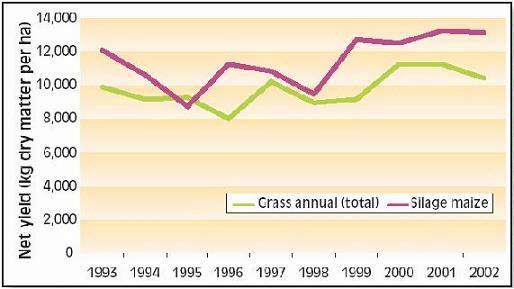
Figure 2. Year-to-year variation in net yields of grass (excluding grazing- and harvest losses) and silage corn at ‘De Marke’ (for lb/ac, multiply by 0.9)
Nutrient Flows
The total nutrient cycle comprises the components herd, manure, soil and crop (roughage and pasture grass). These components can be considered the links in the cycle. The nutrient balance between components shows relative efficiency of nutrient utilization, which helps identify weakest links. Fig. 3 shows the average N cycle for ‘De Marke’ for a period of 10 years (1993 – 2002).
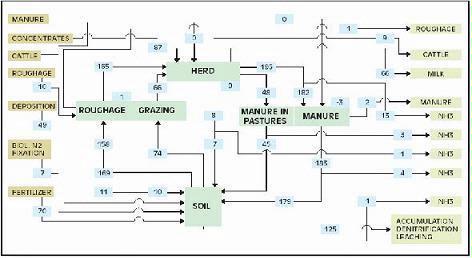
Figure 3. Nitrogen cycle (kg N per ha) of experimental farm ‘De Marke’ averaged over the period 1993 – 2002 (for lb/ac, multiply by 0.9).
The surplus nutrients of the farm can be partitioned into ammonia volatilization and denitrification (N only), and accumulation in soil organic matter, runoff and leaching (N and P) (Table 2). The absence of surface water at ‘De Marke’ means that runoff does not play a role. Average annual surplus over the period 1993 – 2002 was 144 kg N /ha (130 lb/ac) and 3 kg P2O5 /ha (2.5 lb/ac). Since 2000, some changes have been implemented in the design of the farming system (less grazing, lowering the fertilization level) resulting in a lower N surplus in 2002 of 117 kg /ha (105 lb/ac).
Comparison of the nutrient balance of ‘De Marke’ with that of the ‘current average’ farm (on sandy soil in the middle of the 1990s with a milk quotum equal to that of ‘De Marke’) shows that at ‘De Marke’ less fertilizer and feed were purchased. In other words, the realization of very high nutrient utilization efficiencies in animal nutrition and crop cultivation allows similar milk production at much lower input levels. This can be considered the most important aspect of the farming system ‘De Marke’.
| Table 2. A comparison of nutrient balance (N and P2O5) of the ‘De Marke’ averaged over the period 1993 – 2002, and for the year 2002, with the nutrient balance of the average farm in the Netherlands (see text for explanation) in the middle of the 1990s (for lb/ha, multiply by 0.9). | ||||||
|
Nitrogen (kg N/ha)kkk |
Phosphate (kg P2O5/ha) |
|||||
|
De Marke |
Average |
De Marke |
Average |
|||
|
|
93-02 |
2002 |
Dutch Farm |
93-02 |
2002 |
Dutch Farm |
|
INPUT |
|
|
|
|
|
|
|
Concentrates |
86 |
87 |
125 |
28 |
29 |
49 |
|
Roughage |
8 |
0 |
20 |
3 |
0 |
2 |
|
Chemical fertilizer |
64 |
35 |
242 |
1 |
0 |
41 |
|
Organic manure |
0 |
0 |
50 |
0 |
0 |
29 |
|
Biological N fixation |
11 |
27 |
0 |
|
|
|
|
Animals |
0 |
0 |
0 |
0 |
0 |
|
|
Deposition |
49 |
49 |
49 |
2 |
2 |
2 |
|
Miscellaneous |
5 |
5 |
0 |
0 |
1 |
0 |
|
Total |
223 |
203 |
486 |
34 |
32 |
124 |
|
|
|
|
|
|
|
|
|
OUTPUT |
|
|
|
|
|
|
|
Milk |
66 |
64 |
64 |
24 |
23 |
24 |
|
Animals |
9 |
8 |
14 |
6 |
5 |
9 |
|
Roughage |
1 |
0 |
0 |
0 |
0 |
0 |
|
Organic Manure |
1 |
0 |
0 |
0 |
0 |
0 |
|
Total |
77 |
72 |
78 |
30 |
28 |
34 |
|
Changes in Stocks |
2 |
14 |
0 |
1 |
1 |
0 |
|
Surplus |
144 |
117 |
408 |
3 |
3 |
90 |
A.M. JOHNSTON¹ and R. DOWBENKO²
¹ Potash & Phosphate Institute of Canada, Saskatoon, Saskatchewan; ² Agrium Inc., Calgary, Alberta.
Plants require 16 nutrient elements for their growth. Three of the nutrient elements (carbon, hydrogen and oxygen) are derived from air and water. The other 13 are normally obtained by the plant from the soil or applied as amendments (fertilizer, manure, etc.) if they are inadequate or unavailable in the soil. Nitrogen (N), phosphorus (P) and potassium (K) are required by plants in relatively large quantities and are most frequently required as soil amendments for maximum crop growth. In fact, the first three numbers on fertilizer products (e.g., 18-18-18) are the percentages of N, P (expressed in oxide form as P2O5) and K (also expressed as an oxide as K2O). For this discussion, these three nutrients are grouped as “primary” nutrients. Sulphur (S), calcium (Ca) and magnesium (Mg) are required by the plant in moderate quantities and are grouped as “secondary” nutrients. The remaining seven nutrients are grouped as “micronutrients” as they are required in small quantities or applied to crops less frequently. Comparative amounts of these nutrients are shown in Table 1 for a corn crop yielding 18.7 t/ha dry matter. This constitutes the amounts of these nutrients that would be removed from the field if the corn is used as silage.
|
Table 1. Comparison of Quantities of 13 Essential Nutrients typically found in a Corn Crop Yielding 18.7 t/ha dry matter (9 T/ac; for lb/ac multiply by 0.9) |
|||
| Nutrient |
kg/ha |
Nutrient |
kg/ha |
| Nitrogen (N) |
240 |
Chlorine (Cl) |
110 |
| Phosphorus (P) |
44 |
Iron (Fe) |
3 |
| Potassium (K) |
200 |
Manganese (Mn) |
0.6 |
| Zinc (Zn) |
0.6 |
||
| Sulphur (S) |
34 |
Copper (Cu) |
0.2 |
| Calcium (Ca) |
45 |
Boron (B) |
0.1 |
| Magnesium (Mg) |
56 |
Molybdenum (Mo) |
> 0.1 |
Primary Nutrients
Nitrogen (N)
Nitrogen is necessary for making chlorophyll and is directly involved in photosynthesis. Each molecule of chlorophyll contains four N atoms surrounding a magnesium (Mg) atom at the core. All proteins and enzymes contain N in the form of amino acids. Nitrogen is also a component of vitamins. Increasing N supply enhances plant production of carotene (a precursor to vitamin A), the B vitamins (riboflavin, thiamin, and nicotinic acid), and cytokinin (a plant growth hormone).
Nitrogen deficiency in young corn reduces chlorophyll production and causes the entire plant to be pale and yellowish green, with spindly stalks. Later, V-shaped yellowing may appear on the tips of leaves. Since N is mobile within the plant, yellowing begins on the older lower leaves and progresses up the plant as the N is moved up to the newer growing tissues. When N is deficient, the production of chlorophyll and enzymes for photosynthesis is limited, slowing the supply of energy and reducing plant vigour. Also, the root system becomes less prolific, slowing uptake of other nutrients (Table 2). Note the small increase in K concentration. Nitrogen tends to increase K uptake, but only when soil K levels are high. When soil K is low, added N stimulates growth dilution of the K in the plant.
Corn takes up N as inorganic nitrate (NO3 -) and ammonium (NH4+) ions. Ammonium is rapidly converted to nitrate in most soils, therefore, most N uptake is in the nitrate form. However, certain corn hybrids prefer ammonium. Taking up N as ammonium saves the plant a great deal of energy which is required to convert nitrate to ammonium before it is used for protein synthesis. Too much ammonium can be toxic to plants.
|
Table 2. Example of how nitrogen application can increase the concentrations of other nutrients in ear leaf at silking or anthesis (adapted from Illinois and Ontario university data) |
|||
|
Nutrient |
Zero N |
With N |
Increase |
|
Nitrogen (%) |
2.45 |
3.20 |
31% |
|
Phosphorus (%) |
0.22 |
0.29 |
30% |
|
Potassium (%) |
1.93 |
1.96 |
2% |
|
Calcium (%) |
0.88 |
0.90 |
2% |
|
Magnesium (%) |
0.43 |
0.48 |
12% |
|
Zinc (ppm) |
20 |
29 |
45% |
|
Boron (ppm) |
9 |
12 |
34% |
|
Copper (ppm) |
8 |
12 |
44% |
|
Grain Yield, kg/ha* |
5707 |
7212 |
1505 (26%) |
Phosphorus (P)
Although P is not present in the plant in large quantities, it is involved in many critical metabolic functions that occur in the plant’s cells. It influences the activity of many enzymes, is a carrier of energy within the cell and can also store energy as in phytin. Because of the ability of inorganic P compounds to dissociate into various forms, it is an important component to buffer the pH within the cell. It is a component of a variety of organic molecules, such as phospholipids, which are involved in a range of activities and functions. Phosphorus is important for photosynthesis, maintenance and transfer of genetic code, development and growth of new plant cells, and germination and formation of seed.
Phosphorus deficiency usually appears when plants are young. Young plants develop shoots faster than roots, particularly when the air is much warmer than the soil, causing a high P demand per unit of root length (See Applying Starter Fertilizer section). Often soil solution P concentrations are inadequate to meet these high requirements, leading to buildup of carbohydrates and sugars, which causes a dark green or reddish-purple leaf color. Extreme symptoms include spindly stalks which are either barren or have twisted ears with incomplete grain fill. Inadequate P, even in seedlings, frequently delays maturity. Phosphorus enters the corn plant through root hairs, root tips, and the outermost layers of root cells. Beneficial fungi, called mycorrhizae, also enhance P uptake (see Early Phosphorus Nutrition in Corn and the Role of Mycorrhizae section).
Phosphate fertilizers typically contain soluble forms of P that are immediately available to plants. However, soluble P in soil reacts with iron (Fe), aluminum (Al), calcium (Ca), and magnesium (Mg) forming new compounds that are less plantavailable, a process called “fixation.” Maintaining the soil pH between 6 and 7 usually maximizes P availability. The fixed P may eventually become plant-available but this can take months or years. Phosphorus is also contained in soil organic matter and manure, and is gradually released as plant-available forms in a process called mineralization. The P used by a corn crop therefore comes from fertilizer and manure applied for that crop and from such materials applied in previous years.
Potassium (K)
Potassium is involved in photosynthesis, conversion of sugars into energy storage compounds such as starch, conversion of amino acids into proteins, the activation of over 60 enzyme systems, and regulation of leaf pore function. In addition to these factors increasing yield and quality of silage corn, K improves disease resistance, N use efficiency and water utilization by preventing excessive respiration. Potassium in cell water helps protein molecules keep their conformation or shape and maintain their activity.
Potassium deficiency is not always evident visually and can be masked by other crop stress symptoms. Look for leaf discoloration, with older leaf edges turning yellow then brown while the midrib stays green. Conditions that may indicate K deficiency include: thin stands due to poor seedling vigor and disease, slow growth rate and poor N response due to reduced enzyme activity, injury due to stress and leaf diseases, delay of silk emergence by up to one week, stalk lodging due to breakdown of internal stalk tissue and invasion by stalk rot, and chaffy, loose-grain ears and poor grain fill near the ear tip.
Potassium is provided both from the soil’s nutrient reservoir and from fertilizer. The amount of K needed by a corn crop is very site-specific, varying between fields and within fields. The fertilization program should consider several factors that affect availability and uptake of K: soil analysis, nutrient requirements for the target yield, previous crop management practices, cultural practices (tillage) and climatic conditions which interact with K availability and uptake by corn. Soil testing provides a measure of the soil’s K nutrient reserves and an estimate of likely crop response to applied fertilizer. Because K is relatively immobile in most soils, no more than 50 to 60% of fertilizer K can be absorbed by corn during the season of application, even when soil supplies are low and growing conditions are favorable. In the long term, K rates should be such that soil test K is built to and maintained at levels that ensure maximum economic yields.
Timing of Potassium Uptake
The relative amounts of nutrients taken up at each stage of growth will differ and is best shown by uptake of major nutrients and dry matter production during 25-day periods which represent 5 different stages of growth (Table 3). Nearly 75% of the nitrogen, 65% of the P and 85% of the K used by the crop are taken up by the time the ears are tasseling, which is usually about the mid-point of the growing season.
Corn takes up very little N in the first month after planting, but once the crop reaches a height of about one foot uptake becomes very rapid (Table 3). Nitrogen supply before silking can affect the number of kernels set in the ear. Most corn hybrids take up less than 30% of their total N after silking. However, newer hybrids with “stay-green” and multileaf traits take up 40% or more of their N after silking. Removing nitrate from the soil late in the season reduces the amount left in the soil that may be lost over winter (see Post Harvest Nitrate Test section).
When does corn need K? Every day. The amount increases by growth stage until seedlings become fully mature plants. Potassium must be available early for optimum corn development because over 70% of the total K requirement must be in the plant by silking stage, or about 65 days after planting (Table 3). The peak rate of absorption per day occurs just prior to silking. Uptake is slower but not less important during the critical period of grain formation. Uptake per unit of root length is also an important expression of K requirement. Corn grows shoots faster than roots during early growth stages. Therefore, soils sometimes fail to meet the high requirement of each root segment and K deficiency results during the vegetative growth stage. For these situations, K supplemented by a side dress application prior to silking can improve crop productivity.
Balancing N and K
The right balance of N with K improves grain and silage yields, boosts forage quality, improves input use efficiency and provides better protection of groundwater. For example, application of 160 kg/ha (145 lb/ac) of K improved the quality of N-fertilized corn silage by reducing fermentation losses by 5 percent, increasing the carotene content six-fold and nearly tripling total protein production. Application of K also improved N-use-efficiency, helping the corn plants capture nearly 25 percent more N (Table 4) thus lowering the risk of unused N moving down to ground water.
|
Table 3. Example of the Pattern of Uptake of Primary Nutrients by a Corn Crop |
||||||
|
Growth Stage |
Seedling |
Rapid Vegetative |
Silking |
Grain Fill |
Maturity |
Total |
|
(days) |
(1-25) |
(26-50) |
(51-75) |
(76-100) |
(101-125) |
(1-125) |
|
Amount of growth and nutrient uptake during each growth stage (kg/ha)¹ |
||||||
|
Dry Matter |
524 |
3,597 |
6,369 |
6,745 |
1,499 |
18,734 |
|
Nitrogen (N) |
19 |
84 |
75 |
48 |
14 |
240 |
|
Phosphorus (P) |
2 |
12 |
16 |
11 |
3 |
45 |
|
Potassium (K) |
18 |
88 |
62 |
28 |
4 |
200 |
|
Proportion of uptake during each growth stage (%) |
||||||
|
Nitrogen (N) |
8 |
35 |
31 |
20 |
6 |
100 |
|
Phosphorus (P) |
5 |
27 |
36 |
25 |
7 |
100 |
|
Potassium (K) |
9 |
44 |
31 |
14 |
2 |
100 |
|
Table 4. Example of the Influence of K on Corn Grain Yield and N Efficiency |
|||
|
K applied |
Grain |
N-Efficiency |
N Uptake |
|
(kg/ha)¹ |
(kg/ha)¹ |
(kg grain/kg N) |
(kg/ha)¹ |
|
0 |
8,340 |
49 |
194 |
|
50 |
8,780 |
52 |
204 |
|
100 |
10,347 |
62 |
240 |
|
¹ For lb/ac multiply by 0.9 |
|||
Secondary Nutrients
Sulphur (S)
Sulphur is required by plants for the synthesis of certain amino acids (cysteine and methionine), protein formation, and photosynthesis. Symptoms of S and N deficiency are often confused. Sulphur is immobile within the plant and does not readily move from old to new growth. Hence, with S deficiency, yellowing symptoms first appear in younger leaves, unlike N deficiency, where yellowing appears on the older leaves first. Both N and S deficiencies may appear as stunted plants, with a general yellowing of leaves.
Sulphur has been overlooked in many soil fertility programs. But recently, increased crop yields, reduced deposition of atmospheric S, increased use of high analysis fertilizers, and greater awareness are contributing to increased requirements for S fertilizer applications. Most S in the soil is bound in the organic matter and cannot be used by plants until it is converted to the soluble sulphate (SO4 2-) form by soil bacteria (mineralization). Corn growing on deep sandy soils with low organic matter and little clay in the subsoil will likely respond to applications of 10 to 20 kg/ha (9 to 18 lb/ac) SO4-S with pre-plant fertilizers, or with the first N side dressing. If elemental S is used, it may be necessary to apply more than 50 kg/ha (45 lb/ac) in autumn so that at least 10 to 20 kg/ha (9 to 18 lb/ac) of SO4-S is available by early spring.
Calcium (Ca)
Calcium activates growth-regulating enzyme systems, and is needed for cell wall formation and cell division. It improves the root absorption and translocation of other nutrients, and contributes to improved disease resistance. Calcium is taken up by plants as the divalent cation, Ca2+. Along with Mg and K, Ca helps to balance organic acids, which form during cell metabolism.
Symptoms of Ca deficiency are seen in the new growth because Ca is not readily translocated. The symptoms include slowed root development and slowed new leaf growth, with leaf tips sticking together. Calcium deficiency is not likely to occur when the soil is properly limed (See Liming for Optimum Corn Production section). In acidic soils, crop growth is restricted more by toxic concentrations of aluminum and manganese rather than a Ca shortage. Deficiencies are most commonly observed in acid, sandy soils where Ca has been leached by rain or irrigation water, or in strongly acid peat and muck soils with very low soil Ca content.
Magnesium (Mg)
Magnesium, as the central atom in the chlorophyll molecule, is needed for photosynthesis. It is also required for cell division, protein formation, P metabolism, plant respiration, and the activation of several enzyme systems. Magnesium is taken up by the plant as the divalent cation, Mg2+. It is mobile and easily translocated from older to younger tissues.
When deficiencies occur, the older leaves are affected first with a loss of color between the leaf veins, beginning at the leaf margins or tips and progressing inward. Leaves appear striped, with yellowing and browning of leaf tips and edges as symptoms progress (which may be confused with K deficiency), resulting in less photosynthesis and overall crop stunting. Small amounts of Mg can be applied to growing crops through foliar fertilization to correct or prevent developing deficiencies, but the preferred approach is to soil-apply the required amounts before planting.
Plant S, Ca and Mg diagnosis
The best way to diagnose S, Ca and Mg deficiencies is with plant tissue analysis, using specific tissues at different growth stages (Table 5). In the case of S, ratios of total N to total S range from 7:1 to 15:1. Wider ratios may point to possible S deficiency, but should be considered along with actual S and N concentrations in making diagnostic interpretations.
|
Table 5. Sufficient concentrations of S, Ca and Mg in corn tissues |
|||
|
Tissue Selected |
S (%) |
Ca (%) |
Mg (%) |
|
Whole plants less than 12 inches tall |
0.15-0.50 |
0.30-0.70 |
0.15-0.45 |
|
Leaf below the whorl prior to tasseling |
0.15-0.50 |
0.25-0.50 |
0.13-0.30 |
|
Ear leaf at initial silking |
0.21-0.50 |
0.21-1.00 |
0.20-1.00 |
Micronutrients
The function of any nutrient is the origin of the symptom of its deficiency. A listing of the specific functions of each micronutrient (Table 6) helps to illustrate why the detection of a deficiency in corn is often difficult. For example, Fe, Mn and Cu are each involved with chlorophyll formation and a shortage will likely trigger a visible yellowing of plant tissue. Zinc, B, and Mo are each involved with protein formation, which is less likely to trigger a visible symptom, although leaves of zinc deficient plants tend to have yellowish interveinal striping.
|
Table 6. The functions of micronutrients in plant development |
|||||||
|
Plant Growth Function |
Cl |
Fe |
Mn |
Zn |
Cu |
B |
Mo |
|
enzyme systems |
|
X |
X |
X |
X |
|
X |
|
protein formation |
|
X |
|
X |
X |
X |
X |
|
hormones and cell division |
|
|
|
X |
|
X |
|
|
chlorophyll formation |
|
X |
X |
|
X |
|
|
|
disease resistance |
X |
|
|
|
|
|
|
|
photosynthesis |
X |
X |
X |
|
|
|
|
|
N, Fe and/or P metabolism |
|
X |
X |
X |
X |
X |
X |
|
crop maturity |
X |
|
|
|
|
|
|
|
seed formation |
|
|
|
X |
X |
X |
|
|
sugar/starch translocation |
X |
|
|
X |
|
X |
|
Midwest U.S. researchers report that the sensitivity of corn to micronutrient deficiency is low for B and Mo, medium for Cu, Fe and Mn and high for Zn. Liming a strongly acidic soil to a pH level of about 6.0 to 6.5 impacts the availability of all micronutrients except Cl; Fe, Zn, Cu, B and Mn become less available to corn while Mo availability actually increases. Soils high in organic matter are often in need of Cu and B. Alkaline soils, that are also high in P, tend to be responsive to applied Zn. Sandy soils are more likely to be in need of micronutrients than soils high in clay content. Cold, wet soils often trigger Zn deficiency in young corn plants. Land leveling or removal of higher organic matter surface soils also triggers a shortage of Zn. Dry soils late in the season can lead to inadequate B absorption by corn roots.
The total concentration of a micronutrient in the soil is usually a poor indicator of its availability to the corn plant. For example, considerable Fe and Mn might exist in a soil, yet be limiting to plant growth because the nutrients are in a form unsuitable for absorption by roots. The content of B, Zn, Cu or Cl in soils might range from a few to several hundred kg/ha (lb/ac) and adversely affect plant growth as either a deficiency or toxicity. Thus, micronutrient management for high yield corn production should include consideration of the conditions regulating their availability—soil acidity, soil temperature and moisture, genetics, and interactions with other inputs.
Excess concentrations of micronutrients in plants can also be of concern for corn growers. The boundaries for deficiency and excess are close for B, Cu and Zn. Excess levels of Fe and Mn are alleviated by liming acid soils. Excess levels of B, Zn or Cu are seldom a problem in corn production. Occasionally, an excess of Cu or Mn will inhibit Fe metabolism and vice versa.
C.G. KOWALENKO
Agriculture and Agri-Food Canada, Agassiz, British Columbia
The amounts of nutrients that soils contribute to growing crops vary considerably, and amendments such as fertilizer or manure are usually required to obtain high yields. Soil testing is the best currently available option to predict how much and what types of nutrients need to be supplied for a specific field. Although soil test values imply a great degree of reliability, many factors influence their effectiveness for predicting nutrient application requirements. Nutrients are stored in the soil in a variety of complex organic and inorganic forms differing in availability to the crop. Soil tests involve extraction of soil samples with a chemical solution followed by a quantification of nutrients in the solution. The chemical extraction is expected to reflect the amount of nutrient that would be available to the crop. In fact, these extractions have limited ability to simulate plant available nutrients for soils of widely different characteristics and the test that is selected is a compromise for a wide range of soil, weather and crop combinations. Soil tests are based on statistical correlations rather than a defined biological relationship.
General Issues
There are three steps to effective soil testing: sampling and sample preparation, analysis of the sample, and interpretation of the analysis results.
Sampling and sample preparation
When to sample: Time of sampling depends on how the test will be used; for predicting how much nutrient should be added prior to planting, for evaluating the agronomic and environmental performance of nutrient management practices, or for diagnosing a specific crop nutrient problem.
Sampling just prior to planting is recommended for predicting how much fertilizer is required. Sufficient time must be allowed for completing the soil test and for purchasing the recommended fertilizer. Sampling earlier, such as the previous autumn, must be limited to those situations where the nutrient does not change after testing and before applying the nutrients. For example, in south coastal British Columbia where winters are wet and mild, most nutrients measured by soil tests will change over the winter, so sampling close to planting is best (1).
Post-harvest soil sampling is useful for assessing the amounts of available nutrients that were not used by the crop, which is helpful for both agronomic and environmental purposes. This information can be used to adjust management practices (feed-back information) or to monitor long-term trends of nutrients in fields.
Sampling for diagnosing specific nutrient problems is best done when the problem is first observed.
Where to sample: Natural variability of soil test values may be up to 30% in fields that appear uniform (1). Land leveling, banding fertilizers or uneven manure and differential tillage further contribute to variability. To obtain a sample that represents the average nutrient supply in a field or portion of a field, samples from numerous (15 or more) locations should be taken and blended into one sample. Fields where nutrients have been banded require even more samples (2). Unrepresentative areas that can skew results should be avoided or sampled separately.
With the recent advent of yield monitors on harvesting equipment, geographic positioning systems and variable-rate fertilizer applicators, grid sampling of fields with chemical analyses on each sample is becoming more popular (precision agriculture).
How to sample: Depth of sampling depends on mobility of the nutrient and purpose of the test. One approach is to sample to the depth of the majority of root exploration, which in most cases would be the top 15-30 cm (6-12 in). Alternatively, soils are sampled to the depth of cultivation because the soil is mixed and more uniform and most roots are in this zone. Deeper sampling may be required for mobile nutrients with successive depth samples kept separate for analyses and interpretation.
The individual samples from the field that are combined into one to represent the entire field should be the same size, as the samples obtained with using coring devices, to avoid over-representing a specific location. This will minimize bias from any of the sampling locations.
Sample handling: It is important to handle and prepare the sample properly and to avoid contamination, especially with fertilizer or manure. All containers should be clean and of inert material, especially for micronutrient testing. For example, certain paper products contain a lot of boron. Aerial contamination, such as ammonia emitted from manure, must be avoided. Microbial activity should be stopped or minimized after sampling by cooling or drying. Freezing and thawing samples alters some nutrients (3), so refrigeration is preferred for short storage. Nutrients are quite stable in air-dried soil, but drying should be done quickly and at temperatures close to ambient to avoid chemical changes. Air dried samples are easy to mix, use in the laboratory, and store for long periods.
Sample analysis
The methods used to extract and quantify nutrients are usually selected by laboratories. Some general issues related to sample analysis are given below. Details are discussed in a subsequent section.
Extraction of the nutrient from the soil: Extraction involves shaking a sample of soil in a chemical solution. Chemical solutions specific for each nutrient is ideal, but multiple element extracting solutions are popular as this increases efficiency for the laboratory. Multiple element extracting solutions employ a mixture of chemicals, which involves compromises for different soils and nutrients. Also, the soil to chemical solution ratio, and time and vigor of the shaking can influence the amount of nutrient extracted from the soil. Some laboratories scoop a volume of the soil sample for the extraction, while others weigh the sample. This should be considered for interpreting the results or when comparing values for samples analyzed in different laboratories. Some of the filter papers used for extraction contain significant quantities of the elements to be analyzed so they should be washed prior to filtering the sample (4).
Nutrient quantification: The choice of chemical analysis procedures includes consideration of operational factors in the laboratory (e.g., cost of the instrument and its operation, single or multiple analyses) and analytical factors (e.g., sensitivity, freedom from interferences). The type of analysis can have a significant influence on the result. For example, some instruments will measure the total amount of the nutrient including organic or inorganic forms, while others will measure only the inorganic forms. Even laboratories that use the same quantification method produce different results. For example, a recent comparison of 9 laboratories in the US, involving 24 soil samples from 9 states using colorimetry, reported variation from the mean of 10% for Mehlich-III, 13% for Bray-I and 22% for Olsen phosphorus tests (5).
Interpretation
Philosophy: Interpretations of soil tests for fertilizer recommendations vary because of the method used to develop the test (soil test correlation and calibration) and the philosophy for nutrient management (6). In some cases, the goal is to apply sufficient nutrients for optimum yield (referred to as the “sufficiency” approach). In other cases, the goal is to apply sufficient nutrients for the crop and to maintain a specific nutrient content in the soil (“maintenance” approach) or to enhance soil nutrient status (“build-up” approach). The sufficiency approach emphasizes short-term crop production with modest application rates whereas the maintenance and buildup approaches emphasize long-term productivity of the field with greater rates recommended. Soil testing can also be used to monitor long-term trends, but special precautions (e.g., uniform depth and locations of sampling, and method of analysis) are needed.
Units of measurement: Most laboratories use metric units, such as µg/g (µg g-1) or mg/kg (mg kg-1), for expressing their extraction values. Both units are equivalent to ‘parts per million’ or ‘ppm by weight’. These values are often translated into a field unit such a pounds per acre (lb/ac or lb ac-1) or kilograms per hectare (kg/ha or kg ha-1). These units refer to the amount of nutrient in a volume of soil, such as an acre of soil to a depth of six inches or a hectare of soil to a depth of 15 centimeters. To make this conversion, the bulk density (weight of soil in a specified volume) must be used but since these values are not usually measured, an “average” bulk density value is assumed (for mineral soils: ppm in 15 cm or 6 in of soil x 2 = kg/ha or lb/ac). This assumes that a six-inch deep acre of soil weighs two million pounds (15 cm deep ha of soil weighs about two million kg). Organic soils have densities that are less that 1 and should be given special consideration.
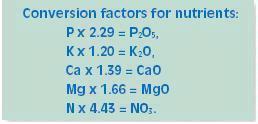
There is often confusion about different units used for the expression of the elements. Most laboratories express the soil sample nutrient measurement on the basis of the element itself (i.e., N, P, K, etc.). However, the units for fertilizers are expressed as %N-%P2O5-%K2O, and recommendations for fertilizer applications are often expressed in these units. Calcium and magnesium tend to be expressed on an element basis (Ca and Mg), but are also sometimes expressed as oxides (CaO and MgO). Clearly, units become more confusing for recommending manure applications.
Although nitrogen is usually expressed as N both for the laboratory analyses and for fertilizers, sometimes this element is expressed as nitrate (NO3). Most nitrogen soil test analyses used today analyze nitrate and express the value as N or NO3 -N but this may not be true of nitrates in feed or drinking water. Care should be taken regarding units of measurement.
Issues Regarding Analysis Methods
Nitrogen (N)
Nitrogen is present in the soil in a variety of forms that change from one to another (see the Nitrogen Cycle section). This has caused the limited use of soil N analyses throughout the world. Most of the N present in agricultural soils is in organic forms yet plants largely feed on inorganic N, particularly nitrate. Nitrate can be readily measured in soils, but the amount in the soil at any one time may not indicate how much is available to plants through the growing season because substantial amounts of inorganic N can be released from the organic forms (a process called mineralization). Unfortunately, the rate of release of inorganic N from the organic matter in the soil cannot be predicted by a chemical analysis at this time. Therefore, N recommendations based on nitrate analyses must take potential mineralization of organic N and losses of nitrate by leaching or as gas into consideration.
Since corn is a long season crop (see The Parable of Fast and Slow Growing Crops section), N can be successfully applied after the crop has been established. A soil test has been developed for guiding sidedress N applications after the crop is established (See Spring Nitrogen Tests section).
Post-harvest soil nitrate analyses can be used to evaluate the agronomic and environmental effectiveness of previous N management (report card) and to adjust N applications for the next season’s crop using feedback information (1) (see Post-Harvest Nitrate Test section).
Phosphorus (P)
Although most soils contain significant proportions of organic P, soil test extractions focus on inorganic P. Solution P, which is extracted by water or a weak solution of calcium chloride, is usually present in low concentrations in soils. The reason is that P is readily adsorbed or precipitated by calcium, magnesium, iron and aluminum compounds and organic matter. These forms are only sparingly soluble. Each contributes different proportions of P to plants, and soil extraction attempts to simulate plant uptake. The correlation between soil P in different extracting solutions and plant growth is affected by soil and weather conditions, hence regions use different extracting solutions (5).
The chemical compositions of some commonly used P extractants are shown in Table 1. The Bray-I extractant was originally developed specifically for P. The Mehlich and Kelowna extraction solutions, developed for multiple nutrient extractions, use some of the same chemicals present in the Bray-I solution.
|
Table 1. Composition of frequently used extraction solutions for soil test P ldeterminations. |
|
|
Extractant |
Composition * |
|
Bray-I |
0.03 M NH4F + 0.025 M HCl |
|
Olsen |
0.5 NaHCOc (pH 8.5) |
|
Mehlich-III |
0.015 N NH4/f + 0.02 M HOAc + 0.25 M NH4NO3 + 0.013M HNO3 + 0.001 M EDTA |
|
Kelowna-I |
0.015 M NH4F + 0.25 M HOAc |
|
Kelowna-II |
0.015 M NH4F + 0.5 M HOAc + 1.0 M NH4OAc |
| * NH4F= ammonium fluoride; HCl = hydrochloric acid; NaHCO3 = sodium bicarbonate; HOAc = acetic acid; NH4NO3 = ammonium nitrate; HNO3 = nitric acid; EDTA = ethylenediamine tetraacetic acid (a chelating chemical largely for micronutrient extraction); NH4OAc = ammonium acetate. | |
The amount of P extracted by each method is often closely correlated. Some new extractants have been proposed based on correlations with previously used procedures without field correlations and calibrations (7). However, direct comparisons are a challenge. Sometimes laboratories change their methods making historic comparisons difficult. Some relationships between different soil P extractions are shown in Table 2. The regression equations help compare values between methods, however, comparisons should be considered to be region-specific. The Alaska data, which is separated into individual soil series, illustrates the variable relationships that can occur for soil types within a region. Although the overall relationships among the soil test methods are generally quite good (r2 values from 0.74 to 0.91), the actual numerical values may differ with soil type.
Table 2. Comparison of P extract methods at various locations
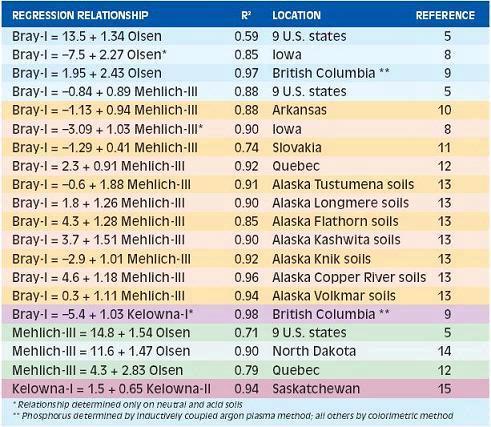
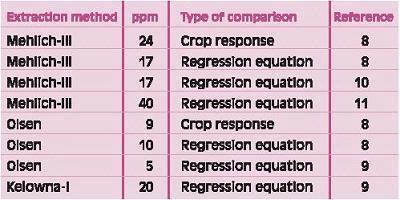
Table 3 compares values derived by either crop response data (8) or by using regression equations for three different extractions equivalent to Bray-I value of 15 ppm. Values were 17-40 for Mehlich-III, 5-10 for Olsen, and 20 for Kelowna-I. This study included crop response data with which the critical value for Mehlich-III and Olsen methods were derived. It is apparent that the regression equations are crude, and using the regression equations derived for the specific region is preferable. Recent research emphasized that actual field calibration data for each method should be used for interpretations even when two methods are closely correlated (16).
Table 3. Comparison of critical values for different extraction solutions with critical value of 15 for Bray-I extraction (derived in an Iowa study (8) determined by crop response data and by calculation using regression equations relating the different extracts).
Analytical instruments also affect P measurements. Colorimeters and ion chromatographs measure inorganic P whereas inductively coupled argon plasma spectrophotometers (ICAP) measure both organic and inorganic P. Various studies have shown that these methods of analysis will result in different P values in the same soil extracts (16, 17, 18, 19, 20, 21). Colorimetric values tend to be slightly greater than ion chromatography values, probably because the strong acids used for colorimetric methods decompose some organic forms of P. Therefore, some of the differences among methods in Table 2 may be due to the quantification method. Studies to develop a new multiple element extraction used the ICAP method for Bray-I and Kelowna-I, but colorimetric analysis for the Olsen extraction method (9). In a study of 10 Quebec soils extracted by Mehlich-III solution, P measured by colorimeter was slightly less than by ICAP (66 vs 72 ppm) but the two methods were highly correlated (12).
Potassium (K)
Some soil K is a structural component of clay minerals or “fixed” in structural voids of certain clay types. Plant available (exchangeable) K is adsorbed to negative charges on the surface of clay minerals, sesquioxides (amorphous iron and aluminum materials) and organic matter. A small amount of K is in the soil solution, which is in equilibrium with the exchangeable fraction.
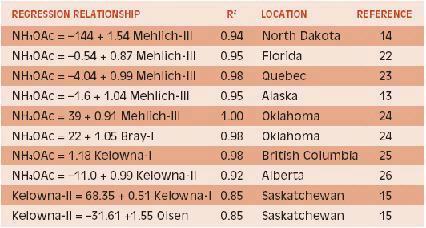
Exchangeable K is typically extracted by ammonium acetate and measured by atomic emission or absorption spectroscopy. Ammonium is particularly effective in displacing K from exchange sites because both atoms are similar in charge and hydrated size. For multiple nutrient analysis with one procedure, ICAP spectrometry is usually coupled with sodium bicarbonate, Mehlich and Kelowna extractions. Results with sodium bicarbonate are somewhat different but correlated to those with ammonium acetate because most soil K is in inorganic form, unlike P. Regression equations among these extraction solutions are shown in Table 4. The nature of the relationship tends to vary with soil type, thus for calculating equivalents among the values it is best to use local data.
Table 4. Comparison of K extracted from soils by different soil test methods.
Magnesium (Mg)
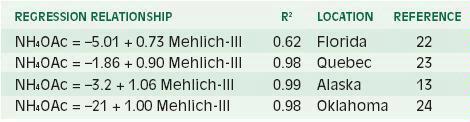
Magnesium, like K, is largely associated with the mineral portion of the soil, and the exchangeable fraction is traditionally extracted with ammonium acetate. However, much less is known about soil test methods for Mg compared to K (27). It is usually assumed that exchangeable Mg is readily available to plants so that ammonium acetate is a suitable soil extractant. The relationship of ammonium acetate with the Mehlich-III extractant is quite good (Table 5).
Table 5. Comparison of Mg extracted from soils by different soil test methods.
Sulphur (S)
Sulphur is often considered to be a “secondary” plant nutrient, required in smaller quantities than N and K but larger quantities than micronutrients such as boron or zinc. Since crop requirements for S are low and variable across regions, relatively little work has been done to develop soil tests. In some locations, sufficient quantities of S are deposited on the soil from the atmosphere (where it is a pollutant) to supply what the crops require but improvements in air quality have reduced this source of S to crops. Sulphur is a coincidental component of some fertilizers. It is chemically bound as potassium sulphate (0-0-50-18S), ammonium phosphate sulphate (16-20-0-15S) and sulphate of potash-magnesia or ‘sulpomag’ (0-0-22-22S). Sulphur is also a contaminant of superphosphate (0-18-0-12S) and triple superphosphate (0-45-0-1S) (28). As fertilizer manufacturers have reduced contaminant S, the requirement for intentional applications of S as fertilizer has increased.
Sulphur is present in the soil in both organic and inorganic forms, with organic S predominant in most soils. Organic S is unavailable to plants unless it is mineralized to inorganic oxidized sulphate (SO4 2-) form. Acidic soils (pH 7), extract S with water or a weak solution of calcium chloride which will not extract adsorbed sulphate in acidic soils. Phosphate-containing solutions are particularly effective and convenient for extraction of both adsorbed and dissolved sulphate (31). Other anions, such as hydroxide, acetate, carbonate and chloride, also displace sulphate but their displacing ability differs from phosphate.
The availability of adsorbed sulphate to plants is uncertain so other extracting solutions have been proposed. For example, hot KCl is thought to extract both solution and adsorbed inorganic sulphate, and to decompose readily plant-available organic S to inorganic sulphate (32). Unfortunately, the relationships between many proposed extractants are not well known (33, 34, 35). Adoption of multiple nutrient extractants (especially for P, K and Mg) for S testing has been constrained by insufficient field correlation data. A study in India (36) reported the following relationships between Mehlich-III (multiple nutrient extractant) and frequently used S extraction solutions:
Mehlich-III = 13.04 + 6.79 CaCl2, r2 = 0.83,
Mehlich-III = 20.82 + 0.92 Ca-PO4, r2 = 0.80, and
Mehlich-III = 13.89 + 0.73 Morgan’s, r2 = 0.87.
The solutions tested were calcium chloride (CaCl2), monocalcium phosphate (Ca-PO4) and sodium acetate plus acetic acid (Morgan’s), and sulphate was measured by a barium-based turbidimetric method. In British Columbia, the Kelowna-I multiple nutrient extractant was adopted for S soil testing after correlating with calcium chloride extraction using 40 soils from across the province (37). The relationship for the two methods is:
Kelowna-I = 2.61 + 1.79 CaCl2 r2 = 0.61.
Some data has shown that Mehlich-II (ammonium fluoride, acetic acid, ammonium chloride and hydrochloric acid) extraction cannot be generally used for determining “the S supplying” ability of soils (38).
A further complication, as for P, is that different analytical methods will measure different forms of S (31). Turbidimetric/colorimetric and ion chromatographic methods measure inorganic sulphate-S, hydriodic acid reduction method measures both organic and inorganic forms of sulphate-S whereas ICAP will measure all inorganic and organic forms of S. Hence, the turbidimetric/colorimetric methods will result in the smallest value, the hydriodic acid method will have intermediate values and ICAP will result in the largest value, depending on forms extracted from the soil.
Calcium (Ca), pH and lime
Most soils, especially those of alkaline pH, have adequate quantities of Ca for crop growth. Deficiencies may occur in acidic soils, but the application of liming materials to maintain a suitable pH (near neutrality for most crops) is assumed to provide more than adequate amounts of Ca. Since applications of liming materials is standard soil practice in most regions (except where sources are scarce), pH is widely used to indicate liming needs.
There is often confusion in interpretation of buffer and non-buffer pH values (39). Non-buffer pH values, usually a measurement of soil in water or a weak solution of Ca or K, indicates the pH of the soil as experienced by plants. Buffer pH indicates how much liming material needs to be applied to achieve a non-buffer pH value. Laboratories use different buffer solutions for this measurement and each would have a different relationship or equation to derive the lime requirement. A single-buffer method is used quite widely and the equations used to determine tonnes of limestone per hectare (for T/ac multiply by 0.45) for mineral soils that should be applied to achieve a pH of 6.5 are (40):
Quebec lime recommendation = 107.2 – 22.27 pH + 0.983 (pH2), and
Ontario lime recommendation = 291.6 – 80.99 pH + 5.64 (pH2).
While liming recommendations are based on limestone (calcium carbonate or CaCO3), other materials can also be used. The acid-neutralizing capacity of these products, expressed relative to limestone as calcium carbonate equivalent (28) are:
- pure, finely ground limestone 100%
- hydrated lime (calcium hydroxide or Ca(OH)2) 120-130%
- burned or quick lime (calcium oxide or CaO) 150-175%
- dolomite or dolomitic limestone (CaCO3.MgCO3) 110%
Both hydrated and burned/quick lime react quickly in the soil but require careful handling because of their caustic nature. Dolomite materials have relatively high Ca carbonate equivalents and supply Mg but act slowly and are usually more expensive than limestone (see Liming to Increase Cell pH section).
Micronutrients
Nutrients required by crops in very small quantities, such as boron, iron, manganese, copper, zinc, and molybdenum, are called micronutrients. Chloride is referred to as a micronutrient but required in greater quantities than true micronutrients (see Latest on Chloride Fertilizer section). Inadequate amounts of these elements will reduce crop growth and quality, and plants would respond to applications of these as fertilizer. Although soil tests have been proposed for all of these nutrients (41, 42, 43, 44), field trials to support the use of these are quite limited in most locations as is the case for British Columbia (45). These soil tests should be used only when all other nutrient problems have been resolved. Test strips in the field should be used to assess response before micronutrients are applied extensively because of both their cost and possible detrimental effects from excessive applications.
References
1. Kowalenko, C.G. 1991. Fall vs. spring soil sampling for calibrating nutrient applications on individual fields. J. Prod. Agric. 4, 322-329.
2. Zebarth, B.J., M.F. Younie, J.W. Paul, J.W. Hall and G.A. Telford 1999. Fertilizer banding influence on spatial and temporal distribution of soil inorganic nitrogen in a corn field. Soil Sci. Soc. Am. J. 63, 1924-1933.
3. Esala, M.J. 1995. Changes in the extractable ammonium- and nitrate-nitrogen contents of soil samples during freezing and thawing. Commun. Soil Sci. Plant Anal. 26, 61-68.
4. Scharf, P. and M.M. Alley 1988. Centrifugation: a solution to the problem posed by ammonium and nitrate contamination of filters in soil extract analysis. Soil Sci. Soc. Am. J. 52, 1508-1510.
5. Kleinman, P.J.A., A.N. Sharpley, K. Gartley, W.M. Jarrell, S. Kuo, R.G. Menon, R. Myers, K.R. Reddy and E.O. Skogley 2001. Interlaboratory comparison of soil phosphorus extracted by various soil test methods. Commun. Soil Sci. Plant Anal. 32, 2325-2345.
6. Brown, J.R. (ed.) 1987. Soil testing: sampling, correlation, calibration, and interpretation. Special Publication number 21. Soil Sci. Soc. Am., Madison, Wisc.
7. Fixen, P.E. and J.H. Grove 1990. Testing soils for phosphorus. Pages 141-180 IN R.L. Westerman (ed.) Soil testing and plant analysis. Third edition. Book series number 3. Soil Sci. Soc. Am., Madison, Wisc.
8. Mallarino, A.P. 1997. Interpretation of soil phosphorus tests for corn in soils with varying pH and calcium carbonate content. J. Prod. Agric. 10, 163-167.
9. van Lierop, W. 1988. Determination of available phosphorus in acid and calcerous soils with the Kelowna multiple-element extractant. Soil Sci. 146, 284-291.
10. Sabbe, W.E. and S.C. Dunham 1988. Comparison of soil phosphorus extractants as affected by fertilizer phosphorus sources, lime recommendation and time among four Arkansas soils. Commun. Soil Sci. Plant Anal. 29, 1763-1770.
11. Matejovic, I. and A. Durackova 1994. Comparison of Mehlich 1-, 2-, and 3-, calcium chloride-, Bray-, Olsen-, Enger-, and Schachtschabel-extractants for determinations of nutrient in two soil types. Commun. Soil Sci. Plant Anal. 25, 1289-1302.
12. Tran, T.S., M. Giroux, J. Guilbeault and P. Audesse 1990. Evaluation of Mehlich-III extractant to estimate the available P in Quebec soils. Commun. Soil Sci Plant Anal. 21, 1-28.
13. Michaelson, G.J., C.L. Ping and G.A. Mitchell 1987. Correlation of Mehlich 3, Bray 1, and ammonium acetate extractable P, K, Ca, and Mg for Alaska agricultural soils. Commun. Soil Sci. Plant Anal. 18, 1003-1015.
14. Schmisek, M.E., L.J. Cihacek and L.J. Swenson 1998. Relationship between the Mehlich-III soil test extraction procedure and standard soil test methods in North Dakota. Commun. Soil Sci. Plant Anal. 29, 1719-1729.
15. Qian, P., J.J. Schoenaru and R.E. Karmanos 1994. Simultaneous extraction of available phosphorus and K with a new soil test: a modification of Kelowna extraction. Commun. Soil Sci. Plant Anal. 25, 627-635.
16. Mallarino, A.P. 2003. Field calibration for corn of the Melich-3 soil phosphorus test with colorimetric and inductively coupled plasma emission spectroscopy determination methods. Soil Sci. Soc. Am. J. 68, 1928-1934.
17. Bolland, M.D.A. and I.R. Wilson 1994. Comparison of standard and total Colwell procedures for measuring soil test phosphorus. Commun. Soil Sci. Plant Anal. 25, 2395-2407.
18. Hylander, L.D., H.-I. Svensson and G. Simán 1995. Comparison of different methods for determination of phosphorus in calcium chloride extracts for prediction of availability to plants. Commun. Soil Sci. Plant Anal. 26, 913-925.
19. Hylander, L.D., H.-I. Svensson and G. Siman 1996. Different methods for determination of plant available soil phosphorus. Commun. Soil Sci. Plant Anal. 27, 1501-1512.
20. Masson, P., C. Morel, E. Martin, A. Oberson and D. Friesen 2001. Comparison of soluble P in soil water extracts determined by ion chromatography, colorimetric and inductively coupled plasma techniques in ppb range. Commun. Soil Sci. Plant Anal. 32, 2244-2253.
21. McDowell, R.W. and A.N. Sharpley 2001. Soil phosphorus fractions in solution: influence of fertilizer and manure, filtration and method of determination. Chemosphere 45, 737-748.
22. Alva, A.K. 1993. Comparison of Mehlich 3, Mehlich 1, ammonium bicarbonate-DTPA, 1.0M ammonium acetate, 0.2M ammonium chloride for extraction of calcium, magnesium, phosphorus, and potassium for a wide range of soils. Commun. Soil Sci. Plant Anal. 24, 603-612.
23. Tran, T.S. and M. Giroux 1989. Évaluation de la méthode Mehlich-III pour déterminer les éléments nutritifs (P, K, Ca, Mg, Na) des sols du Quebéc. Agrosol 2, 27-33.
24. Hanlon, E.A. and G.V. Johnson 1984. Bray/Kurtz, Mehlich III, AB/D and ammonium acetate extractions of P, K and Mg in four Oklahoma soils. Commun. Soil Sci. Plant Anal. 15, 277-294.
25. van Lierop, W. and N.A. Gough 1989. Extraction of potassium and sodium from acid and calcareous soils with the Kelowna multiple element extractant. Can. J. Soil Sci. 69, 235-242.
26. Ashworth, J. and K. Mrazek 1995. “Modified Kelowna” test for available phosphorus and potassium in soil. Commun. Soil Sci. Plant Anal. 26, 731-739.
27. Habey, V.A., M.P. Russelle and E.O. Skogley 1990. Testing soils for potassium, calcium, and magnesium. Pages 181-227 IN R.L. Westerman (ed.) Soil testing and plant analysis. Third edition. Book series number 3. Soil Sci. Soc. Am., Madison, Wisc.
28. Soil Improvement Committee California Fertilizer Association 1980. Western Fertilizer Handbook. The Interstate Printers and Publishers, Inc., Danville, Ill.
29. Tabatabai, M.A. 1982. Sulfur. Pages 501-538 IN A.L. Page, R.H. Miller and D.R. Keeney (eds.) Methods of soil analysis. Part 2. Chemical and microbiological properties. 2nd ed. Agonomy No. 9. Am. Soc. Agron., Madison, Wisc.
30. Kowalenko, C.G. 1996. Interpretation of autumn soil tests for hazelnuts. Can. J. Soil Sci. 76, 195-202.
31. Kowalenko, C.G. 1993. Extraction of available sulfur. Pages 65-74 IN M.R. Carter (ed.) Soil sampling and methods of analysis. Lewis Publ., Boca Raton.
32. Anderson, G.C., G.J. Blair and R.D.B. Lefroy 1998. Soil-extractable sulfur and pasture response to applied sulfur 2. Seasonal variation in soil sulfur tests and sulfur response by pastures under field conditions. Australian J. Experimental Agric. 38, 575-582.
33. Alewell, C and E. Matzner 1996. Water, NaHCO3-, NaH2PO4- and NaClextractable SO4 2- in acid forest soils. Zeitschrift Für Pflanzenernahrung und Bodenkunde 159, 235-240.
34. Prietzel, J. and C. Hirsch 2000. Ammonium fluoride extraction for determining inorganic sulphur in acid forest soils. European J. Soil Sci. 51, 323-333.
35. Schmalz, V., T. Grischek, G. Gerstäcker and E. Eckard 2001. Comparison of different extractants for the determination of inorganic sulphate in gypsumfree agricultural soils. J. Plant Nutr. Soil Sci. 164, 577-578.
36. Rao, T.N. and P.K. Sharma 1997. Evaluation of Mehlich III as an extractant for available sulphur. Commun. Soil Sci. Plant Anal. 28, 1033-1046.
37. Kowalenko, C.G. 1993. Sulphur. Pages 33-37 IN C.G. Kowalenko (ed.) Soil test analysis methods for British Columbia agricultural crops. Proceedings of a workshop of the British Columbia Soil and Tissue Testing Council, meeting 24 November 1992. B.C. Min. Agric., Fisheries and Food, Victoria.
38. Matula, J. 1999. Use of multinutrient soil tests for sulphur determination. Commun. Soil Sci. Plant Anal. 30, 1733-1746.
39. van Lierop, W. 1990. Soil pH and lime requirement. Pages 73-126 IN R.L. Westerman (ed.) Soil testing and plant analysis. Third edition. Book series number 3, Soil Sci. Soc. Am., Madison, Wisc.
40. Tran, T.S. and W. van Lierop 1993. Lime reqirement. Pages 109-113 IN M.R. Carter (ed.) Soil sampling and methods of analysis. Lewis Publ., Boca Raton, Florida.
41. Liang, J. and R.E. Karmanos 1993. DTPA-extractable Fe, Mn, Cu, and Zn. Pages 87-90 IN M.R. Carter (ed.) Soil sampling and methods of analysis. Lewis Publ., Boca Raton, Florida.
42. Gupta, U.C. 1993. Boron, molybdenum, and selenium. Pages 91-99 IN M.R. Carter (ed.) Soil sampling and methods of analysis. Lewis Publ., Boca Raton, Florida.
43. Martens, D.C. and W.L. Lindsay 1990. Testing soils for copper, iron, manganese, and zinc. Pages 229-264 IN R.L. Westerman (ed.) Soil testing and plant analysis. Third edition. Book series number 3, Soil Sci. Soc. Am., Madison, Wisc.
44. Johnson, G.V. and P.E. Fixen 1990. Testing soils for sulphur, boron, molybdenum, and chlorine. Pages 265-273 IN R.L. Westerman (ed.) Soil testing and plant analysis. Third edition. Book series number 3, Soil Sci. Soc. Am., Madison, Wisc.
45. Kowalenko, C.G. and G.H. Neilsen 1992. Assessment of the need for micronutrient applications for agricultural crop production in British Columbia. Agric. Canada Res. Branch Tech. Bull, 1992-5E.
C.G. KOWALENKO
Agriculture and Agri-Food Canada, Agassiz, BC
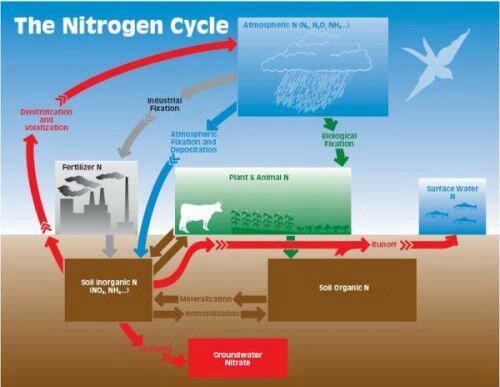
One of the fundamentals of nature is that matter is not spontaneously created or destroyed, but can be changed from one form to another. This is true of nitrogen (N), which cycles through every part of the ecosystem in well known but exceedingly complex flows.
To understand the N cycle, it is best to recognize that N is present in various forms and names have been given to the processes that convert it from one form to another (Fig. 1). The forms that contain the majority of N in nature, N gas (N2 constitutes 80% of the atmosphere) and soil organic N, are not directly available to plants. Inorganic N in the form of ammonium or nitrate is available to plants.
Conversion of N gas to a plant available (inorganic) form is called fixation, and it is accomplished naturally in the atmosphere, biologically and industrially (Fig. 1). Fixation of N gas occurs in the atmosphere during lightning events. Ammonium in the atmosphere can be deposited directly to plants and soil or via precipitation. Biological fixation is carried out by N-fixing bacteria living symbiotically with many species of legumes, by free-living bacteria and by blue-green algae. Fertilizer N is manufactured (fixed) industrially using the very energy demanding Haber-Bosch process invented prior to World War I. This single industrial process provides most of the N fertilizer needed to feed the human population. It should be the goal of every farmer to conserve valuable fixed N.
Organic N accumulates in soil by additions of plant and animal wastes or residues. Conversion of soil organic N to inorganic N is called mineralization whereas the conversion of inorganic N to organic N is called immobilization. The first inorganic N product of mineralization is ammonium. Ammonium is usually converted quickly to nitrate by a process called nitrification, hence, nitrate is the dominant inorganic N form available to plants. Ammonium is lost from the soil to the atmosphere by volatilization and nitrate by denitrification. Nitrate does not adhere to soil particles and, hence, is vulnerable to leaching out of the root zone as water percolates through the soil. Soil organic and inorganic N can be lost to surface water by erosion and run-off.
Nitrogen in the Environment
The biological or non-biological processes that convert N from one form to another respond to climatic, soil and environmental conditions differently. An understanding of the forms and factors that influence conversion is necessary for efficiently managing N on farms.
Although N is an essential nutrient for all plants and animals, it can have detrimental environmental effects on air, water and natural ecosystems. Ammonia, which volatilizes from manures and fertilizer into the atmosphere, has a strong odour. At high concentrations, it can be an irritant or even directly toxic to humans. Ammonia in the atmosphere may be deposited near (1 km or 0.6 mi) the source in significant quantities. Ammonia that is not immediately deposited can combine in the air with nitrate and sulphate from factories and automobiles to form fine particulates which reduce air quality (white haze) and can be detrimental to human health. High levels of fine particulates have been recorded in the confined valleys of the lower Fraser River (BC) and San Joaquin Valley (CA). Atmospheric ammonia deposited on the earth or surface water bodies via precipitation can be toxic to some aquatic organisms, stimulate excessive biological growth in water (eutrophication), accelerate acidification of soils or cause changes to natural aquatic and terrestrial ecosystems that may degrade species diversity. In contrast to ammonia, nitrate is not volatile but contributes to atmospheric contamination during denitrification, which occurs most often in wet soils. The main product of denitrification is innocuous atmospheric N gas (N2), but nitric oxide (NO) and nitrous oxide (N2O), are formed in small quantities as intermediates. These are potent greenhouse gases which contribute to global warming. Small amounts of nitrous oxide are also formed during nitrification.
Nitrogen in the soil during corn production is subject to nutrient loss by leaching, erosion and runoff, particularly before planting and after harvest when there is little cover over the soil. Erosion and runoff (Fig. 1) of N (both organic and inorganic) contribute to eutrophication of surface waters and ammonium in surface water is very toxic to many aquatic organisms such as fish. Nitrate leached from soils into groundwater is a widely recognized environmental and health concern, particularly due to the potential death of infants from “blue baby” syndrome.
B.J. ZEBARTH
Agriculture and Agri-Food Canada, Fredericton, New Brunswick
Most of the N in soils is organic and must be converted to nitrate or ammonium (mineralization) before it is available to plants (see The Nitrogen Cycle section); nitrate is the predominant inorganic form in most soils. Nitrate can be high in early spring in some fields as a result of the carry-over from the previous growing season. The amount of carry-over varies with the amount of soil nitrate present in fall and the losses over the fall and winter. In some locations, such as coastal regions of the Pacific Northwest which are mild and wet, carry-over is minimal. In locations where winters are cold and dry, carry-over can be considerable. When the amounts of carry-over nitrate plus mineralized N is less than the crop requires, application of N as fertilizer or manure is required.
The amount of soil inorganic N that will be mineralized during the growing season cannot currently be predicted with a chemical analysis (see Determining Nutrients Available in Soils section), therefore, soil N testing is limited to measuring inorganic N. In south coastal British Columbia, where soil N fertility on dairy farms is high due to a history of manure use, net soil N mineralization is commonly greater than 100 kg N/ha, with some fields exceeding 200 kg N/ha. In locations where carry-over nitrate is leached below the root zone over winter, a pre-plant test has limited value for determining fertilizer requirements. Since corn is a long-season crop (see Parable of the Fast and Slow Growing Crops section), soil nitrate testing can be delayed to just prior to sidedress fertilizer time in order to detect as much soil nitrate as possible from mineralization and nitrification.
Two Soil N Tests: PPNT and PSNT
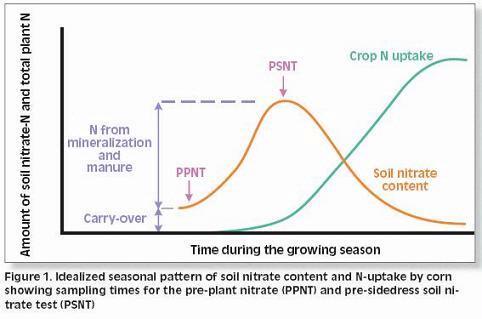
The two most common soil N tests used for determining nitrogen available for corn are the pre-plant soil nitrate test (PPNT) and the pre-sidedress soil nitrate test (PSNT). The PPNT is based on the soil nitrate concentration to 60-cm depth measured before planting (Fig.1). This test measures mainly the amount of soil nitrate carried over from the previous growing season plus early-season soil N mineralization. This test works best in dry or cold climates where carry-over of nitrate from the previous year contributes a major proportion of the total soil N supply. Disadvantages of the PPNT are that the sample is taken prior to most growing season mineralization and nitrification of soil organic matter and spring applied manure N. The PPNT might be improved in some fields by including a measure of soil ammonium concentration.
The PSNT is based on the soil nitrate concentration to 30-cm depth measured at the six-leaf stage, just prior to the period of rapid crop N uptake (Fig. 1). The PSNT works best when no more than 20-30 kg N/ha (18-27 lb/ac) is banded at planting. Based on studies in coastal British Columbia, soil nitrate measured at this time includes little carry-over from the previous growing season, about 50% of the soil N mineralization which will occur throughout the growing season, and most of the available N from spring-applied liquid dairy manure (1). Usually, most nitrification of soil and manure ammonium is complete by the time the PSNT sample is taken, so measurement of soil ammonium is not required. However, where corn was planted after plough-down of forage grass in early May (i.e. after first cut), more than half of the plant available N in the soil was still in ammonium form when the PSNT sample was taken.
Thanks to the delayed sampling, the PSNT is more sensitive to soil N ineralization and spring manure application than the PPNT, and, except where carry-over is substantial, should provide better estimates of fertilizer N requirement than the PPNT. In cases where carry-over N is significant, it may be helpful to use the PPNT to choose an appropriate spring manure application rate, and to use the PSNT to choose an appropriate sidedress fertilizer N rate.
How to use pre-sidedress soil nitrate tests (PSNT)
It should be part of a nitrogen management system:
- Manage manure according to local environmental guidelines; in some years, liquid manure alone may supply enough N for your crop.
- Do not broadcast N before planting. Corn requires little N early in the growing season.
- Apply a low rate of N (20-30 kg/ha or lb/ac) with the planter. Nitrogen applied by the planter is not measured by the PSNT.
- Use the PSNT to decide how much, if any, fertilizer N to apply at sidedress.
Sampling protocol:
- Sample to 30-cm (1-ft) depth midway between corn rows to avoid fertilizer banded with the planter.
- Take at least 10 cores per field when the corn is at the 6-leaf stage or 15-30 cm (6 – 12″) tall.
- Keep the sample cool or frozen until it reaches the lab — a picnic cooler is handy; warm samples will release nitrate and give a fertilizer recommendation which is too low.
- Have the sample analysed for nitrate-N concentration in ppm.
Interpreting results:
- Corn will likely not respond to sidedress N in fields with PSNT values greater than the critical PSNT value. Critical PSNT values vary somewhat with region so use local information. The most common critical PSNT values in North America are 20-25 ppm.
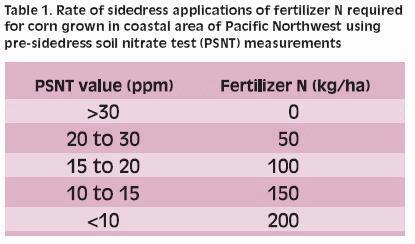
- For PSNT test values less than the critical PSNT value, use local information to predict the fertilizer N requirement at sidedress. Table 1 shows values for coastal Pacific Northwest (1).
- Field measurements have shown that where corn was planted following a late-spring plough-down of forage grass, more than half of the plant available nitrogen in the soil was still in ammonium form when the PSNT sample was taken. In this case, PSNT will over-predict N needs.
Future technology: plant chlorophyll N tests
There is growing interest in estimating plant-N status based on leaf colour for making fertilizer N recommendations (2). This approach can be used rapidly in the field and does not require laboratory analyses. Also, the plant itself provides an indication of its N status, in contrast to soil tests which focus on soil N supply and cannot readily account for variation in crop N demand. The primary disadvantage of this approach is that factors other than crop N status can influence measurements.
Perhaps the most studied field-test method measures ‘leaf greenness’ because of the direct relation with chlorophyll concentration and N status. A hand-held device called ‘SPAD-502’ (Minolta Corp.) measures chlorophyll concentration of a leaf by shining a small beam of light through the leaf. SPAD measurements are quick and repeatable but readings are very sensitive to other factors such as the position of the leaf where the reading is taken, which leaf is tested, growth stage of the plant, and to corn cultivar due to differences in leaf thickness.
Used at the six-leaf stage, the SPAD meter has been found to be useful for identifying corn fields likely to respond to a sidedress N application. Some studies have found the SPAD meter to be as reliable as the PSNT in making a ‘yes/no’ decision on fertilization. However, the SPAD meter has not proved reliable for determining how much sidedress N to apply. Some studies have employed reference plots that receive abundant N fertilizer before planting, and used the ratio of SPAD readings from the field and the reference plots, but the advantage of this approach is not well proven. The SPAD meter might best be used as a preliminary screening tool to decide which fields require a PSNT test sample to be taken.
Readings with the SPAD meter taken after the six-leaf stage have been used successfully for making fertilizer N recommendations in irrigated corn fields. For these fields, N fertilization is done when the ratio of the SPAD readings taken from the field and from the reference plots drops below a threshold value, commonly 90 to 95%.
New instruments which measure light reflected from the crop canopy are being developed for indicating corn N status. None of these instruments are in common use at this time. However, one instrument which appears to be promising is the ‘Hydro N Sensor’. This instrument uses four tractormounted sensors, to measure light reflected from the canopy surrounding the tractor, to measure crop N status in real time. With suitable calibration, it may be possible in future to use such an instrument to perform real-time variable-rate fertilizerN applications.
References
1. Zebarth, B.J., J.W. Paul, M. Younie and S. Bittman 2001. Fertilizer nitrogen recommendations for silage corn in high-fertility environment based on presidedress soil nitrate test. Commun. Soil Sci. Plant Anal. 32, 2721-2739.
2. Zebarth, B.J. J.W. Paul, M. Younie and S. Bittman 2002. Evaluation of leaf chlorophyll index for making fertilizer nitrogen recommendations for silage corn in a high fertility environment. Commun. Soil Sci. Plant Anal. 33, 665-684.
D.M. SULLIVAN1 AND C.G. COGGER2
Oregon State University1, Corvallis, Oregon and Washington State University2, Puyallup, Washington
Nitrate can pollute groundwater if there is a substantial quantity present in the soil when leaching potential is high, usually in winter when precipitation exceeds evapotranspiration. Potential for leaching will increase after harvesting corn since the plant won’t be utilizing water and nitrogen (N). The post-harvest nitrate test (PHNT) measures soil nitrate after crop harvest. This test indicates potential for pollution since it measures soil nitrate not used by the crop and the test helps to evaluate the efficiency of N management.
How to do a PHNT
- Sample to 30 cm (12 in) depth.
- Sample before water moves nitrate below sampling depth. For medium to fine textured soils (loam – clay), sample prior to 13 cm (5 in) of cumulative fall rainfall. Coarse textured soils (sand – sandy loam) have low water-holding capacity and should be sampled prior to 8 cm (3 in) of cumulative fall rainfall. Table 1 shows the average calendar dates when cumulative fall rainfall (after Sept 1) reaches 8-18 cm (3-7 in) at a variety of locations in the wet coastal area of the Pacific Northwest.
- A sufficient number of samples (15-30 cores per field) should be collected to adequately represent the field. Avoid sampling a field that has had manure application within the last thirty days.
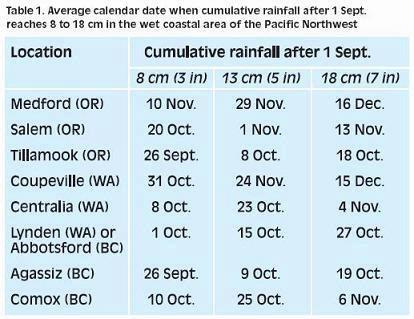
Interpreting PHNT
- The PHNT looks backward in time. It evaluates the balance between N supply and crop uptake for the crops produced during the summer.
- Soil nitrate concentrations are typically high, regardless of overall management, after a perennial grass sod is ploughed down, therefore, it is difficult to attain low PHNT values for corn seeded after grass.
- Low PHNT does not necessarily indicate that too little N had been applied. Continued mineralization of nitrogen can provide enough plant available N for the crop without accumulation of nitrate in the soil under some circumstances.
- It is difficult to achieve low PHNT when using manure. First, the timing and rate of application of organic sources is less flexible than for fertilizer. Second, environmental processes that control the quantity and timing of N mineralization from organic sources is difficult to manage. Nitrogen mineralization can continue after crop harvest. Research with silage corn in Whatcom County, WA shows that PHNT values generally increase with pre-sidedress soil nitrate test (PSNT) values when no fertilizer was sidedressed (Fig. 1).
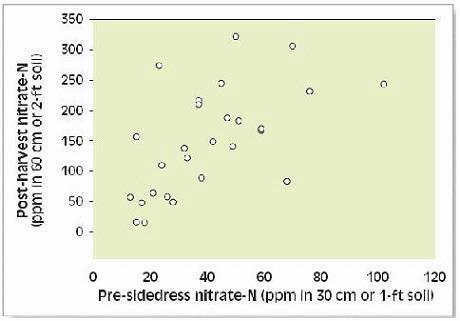
Figure 1. Relationship between pre-sidedress nitrate-N test (PSNT) and amount of N present in soil after corn silage harvest (PHNT) when no sidedress N fertilizer was applied in Whatcom County (Washington) in 1995-96. Each data point represents one point in one year. (Unpublished data, Craig Cogger, Washington State University-Puyallup).
How to reduce PHNT values
- Reduced N fertilizer and manure application rates.
- Plant a relay or post-harvest cover crop that will maximize N removal in late summer and fall.
- Avoid N applications late in the growing season (after August 1).
C. CLARK1, D. HUNT2 and S. BITTMAN2
Whatcom Conservation District, Lynden, Washington1and Agriculture and Agri-Food Canada, Agassiz, British Columbia2
The climate in Whatcom County, located west of the Cascade Mountains in Washington state, has mild, wet winters, and relatively dry summers. A long growing season from late April to mid-October is followed by over 60 cm (24 in) of wintertime rainfall. Land is expensive and dairy farmers are challenged to develop progressive management strategies to remain financially successful and limit their impact on the environment. A primary environmental concern for production of silage corn is wintertime nutrient leaching. The Conservation District, USDA-NRCS and Washington State University are working with Agriculture and Agri-Food Canada, BC Ministry of Agriculture, Fisheries and Food, and Environment Canada to help farmers on both sides of the border manage their nutrients, especially nitrogen. Management of N requires effective soil testing tools and a good understanding of N transformations and movements in the soil as affected by environmental conditions.
Our soil test tools include the pre-sidedress nitrogen test (PSNT) and post harvest nitrogen test (PHNT), formerly called the ‘fall report card test’ (see preceeding chapters). Our work involves evaluating and improving these tools. The PSNT in early summer guides (sidedress) fertilizer use to meet crop needs for the remainder of the season. The PHNT, conducted in early fall, measures the residual soil nitrate after corn harvest that will, if there is no winter cover crop, be lost by leaching and denitrification after the return of fall rains. The PHNT provides feedback on the success of the previous nutrient management.
Figures 1 and 2 show the seasonal patterns of nitrate in the soil, N-uptake by silage corn, and mineralization of N (from soil and manure) on two commercial corn fields in Whatcom County in 2001 and 2003, respectively. The graphs, based on farm-specific data, were produced by mathematical simulation of N processes in response to climate and crops using the computer model NLOS (1), which stands for ‘NLEAP On Stella®’. The soil-N simulation model, NLEAP, was developed by USDA-ARS in Fort Collins, CO; the NLOS version of NLEAP developed by Agriculture and Agri-Food Canada uses a graphical interface (STELLA®) that enables examination of all N flows in the NLEAP model.
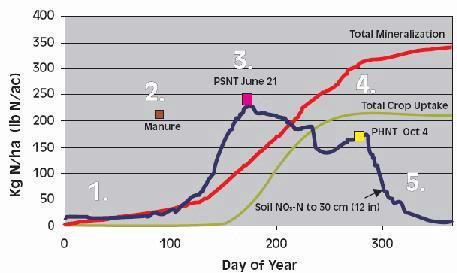
- Explanation of numbers:
- Mineralization rate is slow until soils warm.
- Manure is applied.
- Pre-sidedress nitrogen test (PSNT) measurement (timing critical).
- Post harvest nitrogen test (PHNT) measurement (timing critical).
- Nitrate-N is lost from field by the end of the year.
Figure 1. Graph showing simulated soil-N processes with NLOS model (see text) for the year 2001 in a silage corn field in western Washington. The field has inherently large amounts of soil N.
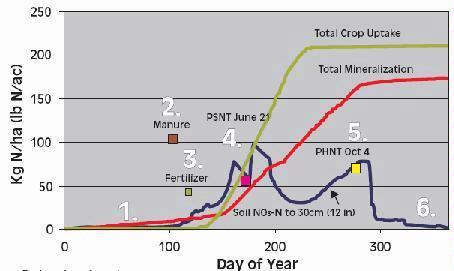
- Explanation of numbers:
- Mineralization rate is slow until soils warm.
- Manure is applied.
- Pre-sidedress nitrogen test (PSNT) measurement (timing critical).
- Post harvest nitrogen test (PHNT) measurement (timing critical).
- Nitrate-N is lost from field by the end of the year.
Figure 2. Actual PSNT and PHNT measurements plotted on a year of simulated soil N processes in a silage corn field in western WA. The soil had moderate levels of N and received moderate manure and fertilizer applications.
The field sampled in 2001 contained considerable soil N (Fig.1). The simulation graph shows the important contribution to soil nitrate concentrations by seasonlong mineralization of organic N from soil and manure. The accumulating soil nitrate was due to conversion (nitrification) of ammonia from manure to nitrate. A PSNT sampling on June 21 showed that this field already contained 267 kg/ha (243 lb/ac) NO3-N in the surface 30 cm (12 in) of soil. This is more N than required by the crop, so most of the N mineralized through the summer and fall is excess and will likely be lost in winter. This is evident from the PHNT of 200 kg/ha (180 lb/ac) of NO3-N remaining in the soil on October 4 which is lost by the autumn rain, as shown by the simulation.
In this field, the manure application rate (250kg NH4-N/ha or 230 lb/acre) was almost double the recommended rate for nitrogen. The PSNT (81 ppm) was considered and no additional sidedress fertilizer was used; in mineral soils this concentration equals approximately 230 kg N/ha (or lb/ac). The PHNT (57 ppm) was evaluated and the manure application rate was reduced in the following year.
The data from this field underscores the need for a catch crop such as a relay crop or a fall cover crop to help take up residual nitrate in the fall. The relay or cover crop must be grazed or harvested in spring, not ploughed-under, otherwise much of the N taken up by the cover crop will be added to the pool of soil nitrate in the following season.
In Fig. 2, the model shows the behavior of soil nitrate-N in a commercial corn field that has been managed successfully with both mineral fertilizer and manure. Manure was applied at 110 kg/ NH4-N per ha (100 lb NH4-N/acre) and fertilizer N was added at planting at 50 kg/ha (44 lb/ac). The PSNT at 16 ppm (approx. 64 kg N/ha or lb/ac) indicated additional fertilizer could be utilized, so at about 9-leaves another 53 kg/ha (48 lb/ac) of N fertilizer was applied and a relay crop (see Cover and Relay Crop section) was seeded to utilize residual NO3 in the soil in fall.
The importance of timing for both the PSNT and the PHNT in Western Washington is shown in Figs. 1 and 2. Soil nitrate accumulates between early April and mid-June. Most N-uptake occurs between mid-June and late August. Release of N from organic matter continues through summer and autumn. Delaying the PHNT after mid-October would have missed much of the soil N. We believe that mis-timing the fall soil sampling is a major source of error and has reduced the value of the PHNT in our region.
The increase of nitrate nitrogen in the fall during the PHNT test window (August 15 – October 15) is due to the mineralization of organic nitrogen (from the soil and historic manure applications) when soils have favourable temperature and moisture for microbial activity.
The results from these field studies show that NLOS simulates the complexity of the nitrogen cycle, the reactions to weather events and the variations in management practices sufficiently well for practical field use. The simulation results help us interpret the PSNT and PHNT measurements and validates our understanding of the behavior patterns of N so that we can manage nutrients effectively.
1. Bittman, S., D.E. Hunt and M.J. Shaffer 2001. NLOS (NLEAP On STELLA®) – A nitrogen cycling model with graphical interface: implications for model developers and users. In M.J. Shaffer et al. (eds) Modeling Carbon and Nitrogen Dynamics for Soil Management. Lewis Publishers, Boca Raton.
J. LEMUNYON
United States Department of Agriculture-Natural Resource Conservation Service, Fort Worth, Texas
The Phosphorus (P) Index is a tool for risk-based management of P that considers the potential for P movement. It was developed in the USA in the early 1990s by a group of national and international scientists from USDA, universities, extension, private and state agencies, and industry called the P Index Core Team (PICT). This group recognized the need for a simple, field-based index using readily available information that could be used to assess sites for potential vulnerability to cause P movement to water bodies. The Index was based on soil, landform and management posing various degrees of risk of detrimental impacts on water quality because of P contamination. As the Index evolved, more research and field data was added to enhance science and methodology of the procedure. Subsequent validations of the Index have shown that the concept is sound and science-based.
The Index ranks sites according to risk of P movement. When analyzing each parameter of the Index, it becomes apparent which of the site conditions and parameters may be imposing greatest influence on the Index. These identified parameters can be the basis for planning and implementing activities to correct the situation. This approach provides producers with the greatest range of P management options while providing for environmental protection.
Transport of P from a field is influenced by rainfall, soil erosion, runoff, and wind. High soil-test P levels and various forms of P applied to fields may increase the amount of P moved from the field. The rate, timing, form, and method of application, along with the site location on the landscape affect the likelihood of P movement and environmental impact. Therefore, relative risk of P to be moved from the landscape will be determined by source and transport factors (below), plus location of the field.
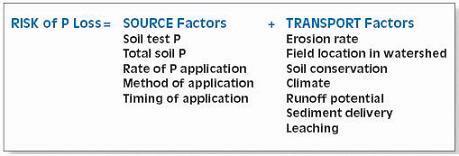
The P Index is designed to identify the vulnerability of agricultural fields to P loss by ranking and rating transport and source factors controlling P loss in surface runoff. The Index is more comprehensive than a simple soil-test P indicator because the Index integrates soil, climate, and field characteristics that influence possible movement of P to surface water. In practice, the P Index value is determined by selecting the rating value for each site characteristic, or factor, multiplying that value by the appropriate weighting coefficient, and summing the weighted products of all factors (Fig.1). Some site characteristics are determined from observations made in the field while additional information comes from land use history and soil surveys. Site characteristics are weighted based on their influence on P movement. In this way, the assessment at all sites is performed in a systematic and consistent way.
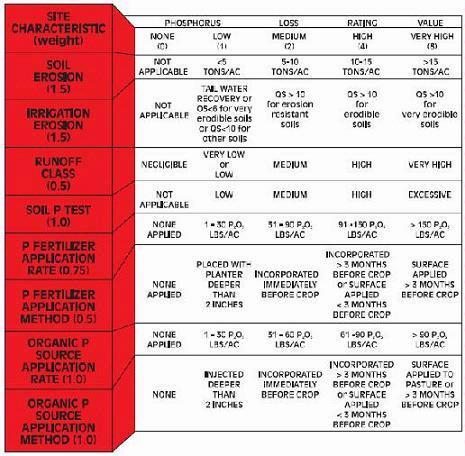
Figure 1. The original P Index was an 8 by 5 matrix listing the site characteristics down the left column and their individual P loss rating value along the top. A specific site assessment was made by adding up the rating values for each site characteristic and comparing the sum to an interpretation table.
Since its inception in 1993, three major changes have been made to the P Index:
1. Source and transport factors are now related in a multiplicative rather than previous additive fashion, in order to better represent actual site vulnerability. For example, if surface runoff does not occur at a particular site, its vulnerability should be low regardless of soil P content. Similarly, a site with high potential for erosion, surface runoff or subsurface flow, but with low soil P, is not a risk for P loss until mineral fertilizer or manure is applied to the field. In the original P Index, a site could be ranked as high risk based on site management factors even though there was no risk of surface runoff or erosion. Catastrophic events, like floods or storms, can over-power the safeguards and carry away any and all stored P.
2. The new Index incorporates an additional transport factor reflecting the distance between field and water body. The new distance categories are based on hydrologic analysis that considers the risk that a rainfall event of a given magnitude will result in surface runoff toward the stream.
3. The new Index uses continuous, open-ended parameterscaling for erosion, soil test P values and P application rates (both fertilizer and manure). This enables indices to better address the effects of very high erosion and soil test P values of the original P Index on P loss potential, and avoid having to subjectively quantify these categories. The open-ended scaling avoids the unrealistic situation where a one or two unit parameter increase could dramatically alter the P Index rating and its interpretation.
General interpretations and management guidance for the P Index ratings:
LOW – Low potential for P loss. If current farming practices are maintained, there is a low risk of adverse impacts on surface waters.
MEDIUM – Medium potential for P loss. The chance for adverse impacts on surface waters exist, and some remediation should be taken to minimize the risk of P loss.
HIGH – High potential for P loss and adverse impacts on surface waters. Soil and water conservation measures and P management plans are needed to minimize the risk of P loss.
VERY HIGH – Very high potential for P loss and adverse impacts on surface waters. All necessary soil and water conservation measures and a P management plan must be implemented to minimize the P loss.
The P Index is used by farm advisors in consultation with the producer to assess the relative potential for leaving the land site and reaching a water body. The Index can thus be used to identify the critical parameters that most strongly influence the Index. Based on the Index, management practices can be applied to the landscape that would decrease the site’s vulnerability to P loss.
S. BITTMAN, D. HUNT, C.G. KOWALENKO, X. WU and T. FORGE
Agriculture and Agri-Food Canada, Agassiz, British Columbia
Importance of Early Phosphorus Nutrition for Corn
Growers in temperate regions are accustomed to observing corn plants with a purple tinge early in the growing season, especially while the soils are cool. The purpling appears to be characteristic of phosphorus deficiency, and it is well known that the roots of juvenile corn plants have difficulty absorbing sufficient amounts of phosphorus, especially from cold soils. Corn hybrids that produce high levels of the pigment anthocyanin are most likely to take on a purple hue.
The use of starter phosphorus fertilizer is often recommended to corn producers to help ensure high yields. The most common method of supplying starter phosphorus is to apply a band about 5 cm (2 in) below and to the side of the seed furrow (see Applying Starter Fertilizer section). Most corn planters are now equipped with sidebanding attachments. This method of application ensures close proximity of phosphorus to emerging roots, reduces fixation of phosphorus by the soil and reduces risk of loss of phosphorus by erosion or runoff. Under no-till, bands of elevated phosphorus remain intact until the next year.
The benefit of starter phosphorus is greater on low than on high phosphorus soils (1). However, starter phosphorus may be beneficial even on high fertility soils if the soils are cool at planting time (2). Typically, soils are cooler under conservation than conventional tillage systems. The visible response by corn to starter phosphorus, especially on cool, wet, compacted, fine textured soils, encourages farmers to use starter phosphorus fertilizer. While early growth is often improved with starter phosphorus, the effect does not always produce higher yield. Averaged over 22 trials in Ontario, starter phosphorus (and K) increased yield of 36-day-old corn by 36% but harvest yield was increased by less than 3% (3). It was concluded that high fertility rates would be required before starter P would be required. Farmers growing silage corn in northerly regions, such as Vermont, often sideband 25-30 kg/ha (22 -27 lb/ac) of starter P, even on soils with moderate to high levels of P from many years of manure application (4) (see Applying Starter Fertilizer section). However, few studies have been conducted to examine the benefits of starter P on silage corn grown on high P soils receiving manure.
In cool, moist coastal British Columbia, almost all silage corn is sidebanded at approximately 30 kg P/ha (27 lb/ac) even though most of the corn receives manure and is grown on soils testing medium to high in soil P. In a study on 24 BC dairy farms, we found that starter P had little effect on whole plant yield and grain yield on all but a few farms (Fig. 1). However, starter P did seem to produce a general increase in dry matter content at harvest, which may be related to improved early growth. Increasing dry matter content at harvest suggests a more mature crop and is economically important to producers.
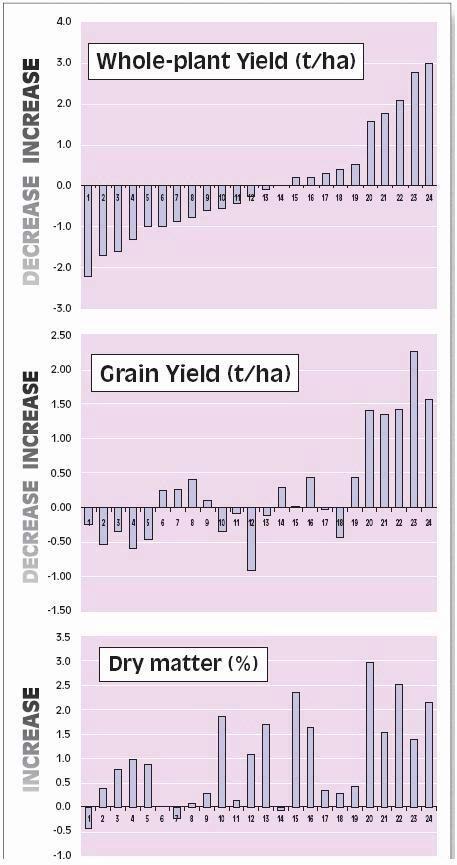
Figure 1. Effect of applying starter P (30 kg /ha or 27 lb/ac) on whole-plant yield, grain yield and whole-plant dry matter percent of silage corn grown on 24 dairy farms in coastal BC in 2001.
The importance of early P uptake (6-leaf stage) for grain yield was shown in a controlled field trial in BC (Fig. 2). Early P uptake also improved crop maturity as indicated by dry matter content at harvest. In contrast, there was very little effect of early P uptake on the amount of P ultimately taken up in the mature crop. Deficiency of P in juvenile plants reduces grain yield potential of corn by reducing the number of kernels formed (5). This study showed that grain yield is reduced by early P deficiency even if ample P is supplied later. In these studies, maximum yield was achieved when concentration of P at the 6-leaf stage was at least 0.5%. Because P concentrations in commercial corn crops are almost always lower than this value (our values are usually under 0.4%, Table 1), one would expect that corn crops will respond to starter P in most cases. But the amount of P taken up at this growth stage is less than 1kg/ha (0.9 lb/ac) while typical application rates exceed the 20-25 kg/ha (18-23 lb/ac) taken up by the whole crop at harvest. Therefore new strategies are needed to enhance levels of P in the plant at the 6-leaf stage with the minimum amount of fertilizer P. This is especially true for soils testing high in P and those that receive ample amounts of manure. Applying excessive starter P on such soils is particularly problematic because it poses a risk of P contamination of surface waterways.
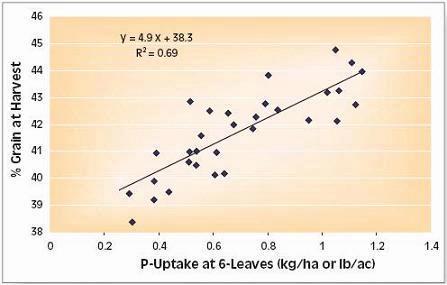
Figure 2. The effect of P-uptake at 6-leaf stage on % grain at harvest in coastal BC (2002)
Role of Mycorrhizae in Early P Nutrition
There is a considerable body of information that a contributing cause of early P deficiency in juvenile corn is inadequate root colonization by a group of fungi referred to as arbuscular mycorrhizae. For example, the phenomenon of P deficiency in juvenile plants of many mycorrhizae-dependent crops growing on previously fallowed soils is related to poor colonization by mycorrhizae (6, 7). Figure 3 shows relatively well-colonized and uncolonized roots of corn. Mycorrhizae filaments extend from the roots into the soil, reaching several times beyond the root hairs. In this way the mycorrhizae increases the zone of P absorption around the roots, effectively increasing the absorbing surface area of the root and assisting the host plants to access nutrients (esp. P, zinc and copper) that are relatively immobile in the soil.
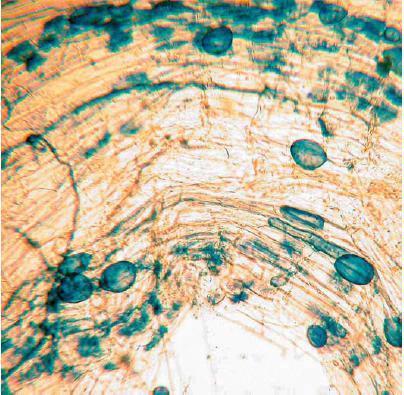
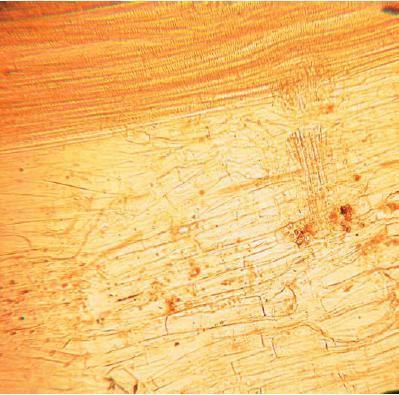
Figure 3. Photomicrograph (approx. 60 X magnification) of corn roots colonized by fungi called arbuscular mycorrhizae (top). The slide on the bottom shows uncolonized corn roots. The mycorrhizae are stained blue and the corn root tissue appears tan.
Although spores of mycorrhizae are very persistent and almost ubiquitous in agricultural soils, they require time to germinate and attach to growing roots, particularly in cold soils (8). Therefore, the new roots of young plants are more rapidly colonized if there is an established network of hyphae in the soil (9). Thus, maintaining a network of viable hyphae in the soil is desirable for early P nutrition of corn. Despite their apparent importance, direct management of mycorrhizae remains largely impractical for field crops (10). There are several reasons for this. First, testing for mycorrhizae in the soil prior to planting is technically problematic and commercially impossible at present. Also, inoculation with spores would probably be ineffective as the young plants require the established fungal networks. Finally, since most agricultural soils are rich in mycorrhizal spores, adding more inoculum may have little impact except in reclaimed soils or other special cases. Soil-test prediction of P requirements would probably be improved if colonization by mycorrhizae could be readily measured or predicted.
Previous Crop Effect on Mycorrhizae and Early P Nutrition
The importance of a previous crop on colonization of corn roots by mycorrhizae can be seen in Fig. 4 and Table 1. More mycorrhizae were found on roots of 3-leaf corn grown after corn than corn grown after either fallow or canola (canola being a crop that does not associate with mycorrhizae). Enrichment of soil P is often reported to reduce mycorrhizal colonization, but this reduction did not occur in our studies. The reason that this reduction did not occur is probably that the P concentration in 3-leaf corn is low and not greatly affected by either soil or fertilizer P. At this stage, most of the P in the corn shoots (0.03 kg/ha or lb/ac) is derived from the seed. Note that at 3- and 6-leaf stages, all corn treatments had concentrations of P of 0.3% or less. The effects of previous crop and starter P increased at the 6-leaf stage, with corn grown after fallow and canola having lower P concentrations than corn grown after corn, especially with no added P. Note that corn following fallow or canola took up much less P than corn following corn, even when ample amounts of starter P (30 kg/ha or 27 lb/ac) were supplied. In other words, the starter P applied in great excess to crop requirement did not fully alleviate the effect on P-uptake by the previous crop! A P soil test that did not take into account the previous crop would not successfully predict early uptake of P by the crop.
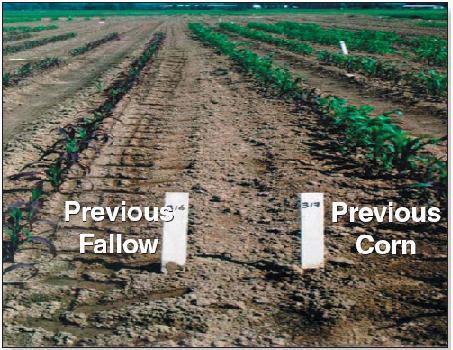
Figure 4. Effect of previous crop on early growth of corn at Agassiz, BC.
Table 1. Effect of previous crop and starter P (30 kg P/ha or 27 lb P/ac) on P concentration and P-uptake in shoots of corn at 3- and 6-leaf stage at Agassiz, BC (mean of 1997 and 1998).
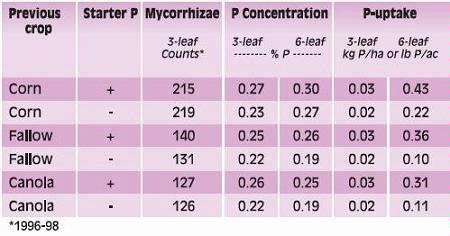
The importance of starter P and the previous crop on growth and yield of corn is shown in Table 2. At the 6- to 9-leaf stage, starter P increased shoot weight of corn by at least 30% when corn was grown after corn, but by 50% when corn was grown after fallow or canola. As with P uptake, starter P did not fully compensate for the effect of the previous crop on yield. The effects of starter P and previous crop were apparent also at harvest but the differences were relatively smaller. Meaningful differences were also noted in the dry matter content at harvest.
Table 2. Effect of previous crop and starter P on biomass of corn at 3-, 6- and 9-leaf stage and yield and dry matter at final harvest at Agassiz, BC (mean of 1997 and 1998).
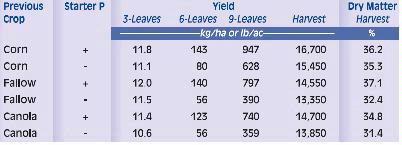
Effect of Tillage on Mycorrhizae and Early P Nutrition
Root colonization by mycorrhizae and associated effects on P are influenced by intensive tillage practices, probably because tillage disrupts the network of mycorrhizae by breaking it apart and dispersing it in the soil profile. In our studies in BC, corn grown on soil which was ploughed and cultivated according to conventional farming practices had significantly reduced early growth (Fig. 5) and root colonization by mycorrhizae than corn grown on zero-tillage or minimum tillage (aeration) systems (Table 3). Note that disking operations, which did not turn over or pulverize the soil, reduced root colonization only slightly. Intensive tillage reduced uptake of P at 6-leaf stage significantly but the effect of tillage intensity on P uptake at harvest was comparatively small and inconsistent.
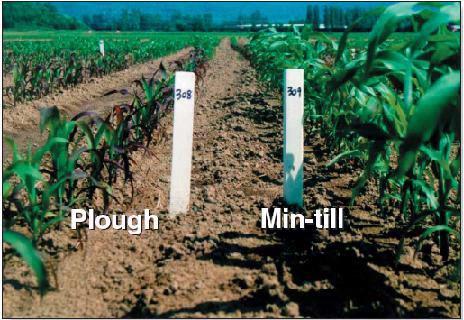
Figure 5. Intensive tillage affects early growth of corn in coastal BC.
Table 3. Effect of increasing tillage intensity on colonization of corn roots by mycorrhizae and uptake of P by corn shoots in coastal BC (1999-2000). Ploughing is the conventional practice in the region. Roto-tilling is popular in gardening and vegetable production.
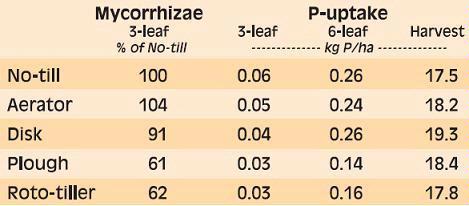
The effect of tillage on growth was not apparent when the corn was at 3 leaves, but by 6 leaves plants grown on minimum till were larger and had less purple coloration than plants grown with intensive tillage (Fig. 4). Intensive tillage reduced corn growth by over 30% at the 6-leaf stage, but there was no apparent effect on final whole-plant yield (Table 4). However intensive tillage did reduce whole-plant dry matter content and grain yield, indicating that the early reduction in P-uptake delayed the maturity of the crop. Delayed maturity is often the outcome of P deficiency during early growth.
Table 4. Effect of tillage on dry matter yield at different growth stages and the dry matter content and grain content at harvest of silage corn in coastal BC (1999-2000). Ploughing is the conventional practice in the region.
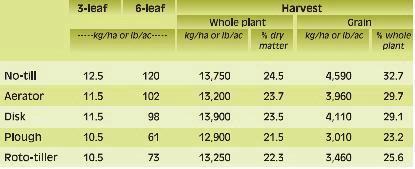
Effect of Manure on Mycorrhizae and Early P Nutrition
There is a special interest in the effect of manure on early P nutrition in the production of silage corn, because silage corn usually receives ample cattle manure. In our studies, we posed two questions: will application of manure affect colonization of corn roots by mycorrhizae and is mycorrhizal colonization beneficial for corn on heavily manured soils? In these trials manure was supplied at approximately 200 kg/ha of total N and about 60 kg/ha of P.
We found that previous fallow greatly reduced mycorrhizal colonization of roots of corn at 3-leaves, and reduce growth and P-uptake at 6-leaves (Table 5). Manure application slightly increased colonization, and also increased P uptake at 6-leaves. Note that even with large doses of manure, corn after fallow with reduced mycorrhizae did not take up as much P as corn after corn at 6-leaves. There was only a slight effect of previous crop and manure treatments on P uptake at harvest, but the effects of these treatments on yield, dry matter content and grain percentage at harvest is large enough to be commercially significant.
Table 5. Effect of previous crop and application of dairy slurry or fertilizer on colonization by mycorrhizae, early growth and P uptake, and final harvest of silage corn in coastal BC (2000-2002).
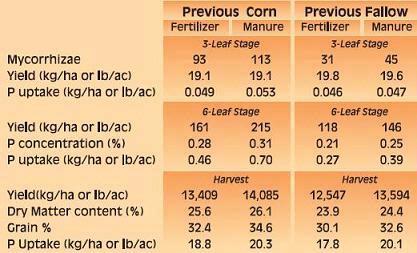
Strategic Application of P-Fertilizer and the Role of Mycorrhizae and Manure
As seen above, the crop consumes only small amounts of P at the critical early growth period, which suggests that only small amounts of starter fertilizer may be needed. We set up a trial to determine if strategic placement of small amounts of P fertilizer could be used to satisfy the requirement for P under contrasting mycorrhizal and manure backgrounds.
The standard farming practice in coastal BC corresponds to 30 kg/ha (27 lb/ac) of sidebanded P applied to corn planted after corn in soil receiving a large dose of dairy slurry. As discussed in the previous section, fallow reduced mycorrhizae colonization of roots and manure and had a slight positive effect on colonization (Table 6, top). Sidebanding with 30 kg/ha of P had little effect on mycorrhizae although placement of P in the seed furrow at 7 kg/ha slightly reduced root colonization. The sidebanding P treatment increased P-uptake at 6-leaves under all preconditions, with the greatest increase on previous fallow without manure and least on previous corn with manure (Table 6, middle). Note that even with sidebanded P, concentrations of P in the shoots at 6-leaves did not surpass 0.32% (not shown), which is lower than the ideal concentration (0.5%) recommended by Barry and Miller (5). While none of the strategic fertilizer applications exceeded the standard farming practice for early P-uptake, the in-furrow application of 7 kg P/ha (6 lb P/ac) was close to the standard in all cases. The 2 kg P/ha (1.8 lb P/ac) furrow (not shown) or seed placed treatments improved P-uptake over control but to a lesser extent than the higher rates. At harvest, all applications of starter fertilizer had a similar effect on whole-crop yield (not shown). However, the harvested crop had a higher grain content from the sidebanded P than from the 7 kg P/ha (6 lb P/ac) furrow treatment (also other starter P treatments), even though there was similar initial P-uptake (Table 6, bottom). One possible explanation is the slightly reduced colonization by mycorrhizae in the 7 kg P/ha (6 lb P/ac) furrow treatment. We still need to learn more about the strategic use of starter fertilizer to reduce rates of application on high-P and manured soils.
Table 6. Strategic use of starter P fertilizer for silage corn under contrasting crop histories and manure applications in coastal BC (2000-2002). Seed: fertilizer placed next to seed; Furrow: fertilizer spread in seed furrow; Sideband: 4 cm (1.5 in) below and beside the seed furrow. Shaded cells represent standard farming practice.
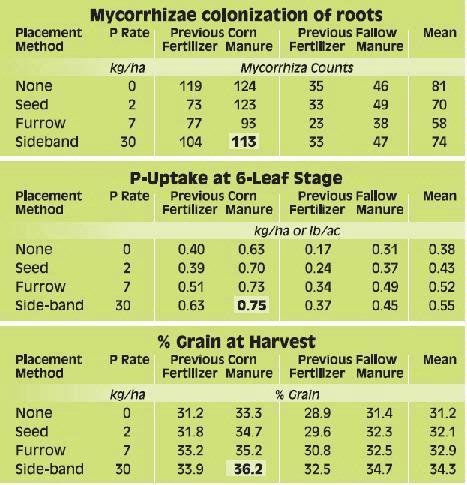
Summary of Mycorrhizae and Early P Nutrition in Corn
- P-uptake in juvenile plants affected grain content, dry matter content and to a lesser extent whole-plant yield at harvest.
- P-uptake to the critical 6-leaf growth stage was less than 1 kg/ha (0.9 lb/ac)
- Root colonization by mycorrhizal fungi enhanced uptake of P in corn to 6 leaves. Colonization was not impeded by manure application or sidebanded P at 30 kg/ha (27 lb/ac)
- Root colonization and early P-uptake was impaired when corn was planted on fields previously fallowed or growing non-mycorrhizal crops such as canola.
- Treatments that reduce mycorrhizal colonization and early P-uptake also reduce grain yield, whole plant dry matter content and to a lesser extent whole plant yield.
- Intensive cultivation reduced colonization by mycorrhiza and early P-uptake.
- Sidebanded P at 30 kg/ha (27 lb/ac) and applications of manure at 60kg P/ha (54 lb/ac) improved early corn P status and harvested crop, provided some insurance against poor colonization, but could not completely overcome the effect of poor colonization of roots by mycorrhizae.
- Small amounts of P applied in the seed furrow or near the seed improved early P uptake but did not fully improve final harvest. There may have been a slight inhibition of root colonization with 7 kg/ha (6 lb/ac) of P applied in the seed furrow.
- New approaches are still needed to reduce the requirement for starter P on heavily manured soils typical of many silage-corn fields.
Conclusion
Applying P at seeding is often encouraged as a low cost insurance against early growth suppression and, by personal observation, failure to do this may lead to disappointing growth. However application of unneeded P, even as a starter fertilizer, is uneconomical and can contribute to nutrient loading of surface and perhaps ground water. This problem is most severe in intensively managed farming systems often associated with production of silage corn. It is therefore important to identify those fields that will be responsive to addition of P. While the financial savings on each farm would be small, the potential environmental benefits, resource conservation and cost savings across large geographic areas may be considerable. Perhaps most important for producers, loading of P in the soil would be reduced, allowing higher rates of manure application. It has been suggested as early as 1980 by Stribley et al. (11) that soil test correlations for P might be improved by taking mycorrhizae colonization into account. However, even recent studies showing requirement by corn for starter P on soils having moderate levels of P, often do not measure or consider the possible influence of mycorrhizae. Although farmers are sometimes warned about potential problems with P nutrition under conditions non-conducive to root colonization, there are presently no general recommendations for applying P that take colonization status into account in any crop world-wide. We believe that improved knowledge of mycorrhizae and strategic P application may reduce application rates of starter P in the future.
References
1. Barber, S.A. 1958. Relation of fertilizer placement to nutrient uptake and crop yield. I. Interaction of row phosphorus and the soil level of phosphorus. Agron. J. 50, 535-539.
2. Young, R.D., D.G. Westfall and G.W. Colliver 1985. Production, marketing and use of phosphorus fertilizer p. 323-376 in O.P. Engelstad (ed.) Fertilizer technology and use. 3rd ed. SSSA, Madison, WI.
3. Bates, T.E. 1971. Response of corn to small amounts of fertilizer placed with the seed: II Summary of 22 field trials. Agron. J. 63, 369-371.
4. Jokela, W.E. 1992. Effect of starter fertilizer on corn silage yields on medium and high fertility soils. J. Prod. Agric. 5, 233-237.
5. Barry, D.A. and M.H. Miller 1989. Phosphorus nutritional requirements of maize seedlings for maximum yield. Agron. J. 81, 95-99.
6. Vivekanandan M. and P.E. Fixen 1991. Cropping systems effects on mycorrhizal colonization, early growth, and phosphorus uptake of corn. Soil Sci. Soc. Am. J. 55, 136-140.
7. Thompson, J.P. 1991. Improving the mycorrhizal condition of the soil through cultural practices and effects on growth and phosphorus uptake by plants. pp. 117-137 in C. Johansen et al. (ed.) Phosphorus nutrition of grain legumes in the semi arid tropics. International Crop Research Institute for the Semi- Arid Tropics. Patancheru, India.
8. Zhang, F., C. Hamel, H. Kianmehr and D.L. Smith 1995. Root-zone temperature and soybean (Glycine max (L.) Merr.) vesicular arbuscular mycorrhizae: Development and interaction with the nitrogen fixing symbiosis. Environ. Exp. Bot. 35, 287-298.
9. Evans, D.G. and M.H. Miller 1990. The role of the external mycelia network in the effect of soil disturbance upon vesicular-arbuscular mycorrhizal colonization of maize. New Phytol. 114, 65-71.
10. Miller, M.H. 2000. Arbuscular mycorrhizae and the phosphorus nutrition of maize: a review of Guelph studies. Can J. Plant Sci. 80, 47-52.
11. Stribley, D.P., P.B. Tinker and R.C. Snellgrove 1980. Effect of vesicular arbuscular mycorrhizal fungi on the relations of plant growth, internal phosphorus concentration and soil phosphate analyses. Journal of Soil Science 31, 655-672.
W.E. JOKELA
Plant and Soil Science Dept., University of Vermont, Burlington, Vermont
Starter fertilizer refers to the placement of plant nutrients in a concentrated zone near the seed with the planter — so named because it gives plants a good early season “start”. Also known as banded or row fertilizer, it refers to an application method or placement of nutrients rather than to a fertilizer type.
Starter fertilizer for corn can result in increased early season growth, increased yields, and sometimes earlier maturity compared to the same amount of nutrients applied as broadcast fertilizer before planting. The advantages of a banded starter fertilizer can be attributed to proximity of the nutrients to the seedling and to increased efficiency of fertilizer use. Early seedling growth is often limited by cool soil temperatures, which slow root growth, plant uptake, and release of N and P from soil organic matter. Hence, placement of nutrients near the roots helps the plants access nutrients, especially P and K, which are essentially immobile in the soil. Band placement also limits contact between soil and fertilizer so less of the P and sometimes K is fixed (tied-up) in the soil. This means more applied nutrients are available for plant uptake.
Crop response to starter fertilizer is most likely with low availability of nutrients and/or cool soil temperatures. As shown in Fig. 1 (top), when soil test P or K are below optimum, band placement of soluble nutrients near the seed is more critical and the probability of a yield increase is high. When soil test P and K are high, yield increases are not as likely (Fig. 1, bottom). Low soil temperatures are more common with early planting, poorly drained soils, and high-residue conservation tillage practices.
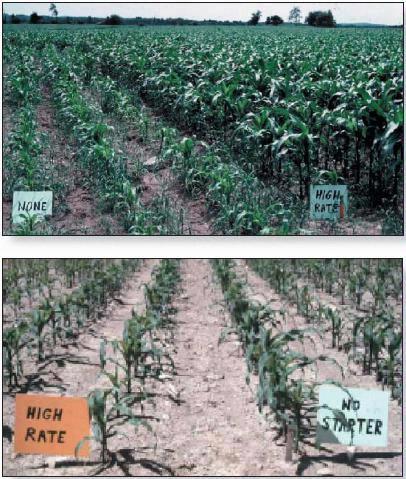
Figure 1. Good response of corn to starter fertilizer on soils testing low in P and K (top) and slight response on soils testing high in P and K (bottom).
Soils with low pH or highly reactive aluminum tie up more of the applied phosphorus, so the advantage of band-placement increases under these conditions. The amount of fixation of K is mainly a function of the type and amount of clay in the soil.
The “starter effect” can occur even when overall soil fertility levels are optimum or higher, but only low rates are required, enough to supply 10 to 20 kg/ha (lb/acre) of N, P2O5, and/or K2O. When nutrient levels are below optimum, starter fertilizer applied at higher rates can be an efficient method to meet the fertility needs of the crop (but see precautions below).
Band placement of fertilizer, especially P, can be considered an environmental “best management practice”. Phosphorus placed in a band below the soil surface at low rates is much less susceptible to loss via surface runoff than surface-applied P and, therefore, less likely to reach streams and lakes where it could degrade water quality. Consequently, the Phosphorus Index, an indicator of potential for P runoff from a field, assigns a lower rating to P applied as a starter fertilizer than to the same amount broadcast on the surface (see The Phosphorus Index to Minimize Water Contamination section). However, even with band placement, excessive application P will enrich the soil and increase P concentrations in runoff.
Using Starter Fertilizer for Corn
Fertilizer materials
A wide range of fertilizer grades are well suited for use as a starter for corn. Phosphorus is the key element for boosting corn growth on cool early spring soils, especially if P soil test levels are low, but some nitrogen should also be included, especially under conservation tillage. Some of the N should be in the ammonium form as it enhances P uptake by the plant. Potassium should also be added if soil test is low. Examples of starter fertilizer include 10-20-20, 10-20-10, 9-23-30, 10-40-10, and 15-15-15. If potassium is not required, then monoammonium phosphate (MAP: 11-55-0) or fluid fertilizers such as ammonium polyphosphate (10-34-0 or 11-37-0) can be good choices. Diammonium phosphate (DAP: 18-46-0) can also be used but note the precautions below. On soils testing very high in P and K, nitrogen fertilizers such as ammonium sulfate can be effective. Dry and fluid fertilizers are equally effective; the choice between forms should be based on cost and convenience.
Band placement
The key to success is to place the fertilizer band close enough to the seedling to provide nutrients but far enough to avoid salt or ammonia injury. The most common placement is 5 cm (2 in) below and 5 cm (2 in) to the side of the seed row (Fig. 2), although distances vary from 3 to 8 cm (1 to 3 in). Low rates of fertilizer can also be applied directly with the corn seed, a method known as “pop-up”. Pop-up application is best suited to high testing soils where only very low rates are needed. This method doesn’t require separate fertilizer openers on the planter. However, extra care must be taken to avoid seedling injury, especially under dry soil conditions (see precautions below).
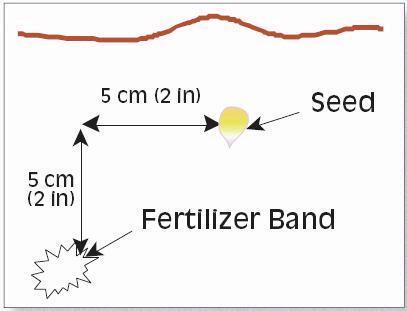
Figure 2: Typical placement of starter fertilizer band is 5 cm (2 in) to the side and below the seed although distances can vary from 3–8 cm (1–3 in).
Application rates
The optimum starter fertilizer rate depends on field conditions and on material used. Only low rates (10 to 20 kg/ha or lb/acre of N, P2O5, and K2O) are needed to provide a starter effect. For most dry fertilizers, this means applications of about 110 kg/ha (100 lb/ac), which is a minimum rate for many planters. For example, 100 kg of a 15-15-15 fertilizer would supply 15 kg each of N, P2O5, and K2O (100 lb would supply 15 lb of each nutrient). If soil test P and K levels are high or if manure was applied, this low rate of P and K may be adequate. However, applying 100 units of a high P analysis fertilizer such as 11-55-0 or 10-40-10 may be excessive under these conditions. Under low N conditions, a starter fertilizer N rate of 30 to 50 kg/ha (27 to 45 lb/acre) can carry over the corn plants until sidedress time. This would usually require a fertilizer with a higher N:P ratio, e.g. 1:1 or even 2:1, to avoid excess P.
If soil test levels are in the low to optimum range, then a higher rate of starter fertilizer can be used to supply most or all of the P and significant portions of the N and K. A high amount of P in the starter band is not a concern, but too much N and/or K can cause seedling injury (see precautions below). For soils testing low in P or K, a combination of starter and broadcast fertilizer or manure is recommended.
Precautions with starter fertilizer
Fertilizer salts, primarily N and K compounds, can cause poor germination and seedling injury if excessive rates are applied near the seed. To prevent these problems, limit the amount of N + K2O banded with corn planter. Specific limits depend on soils and weather conditions, ranging from 40 to 100 kg/ha (36 to 90 lb/acre) for 2 x 2 placement and from 5 to 10 kg/ha (4.5 to 9 lb/acre) for seed-placement. Another concern is the release from some N-containing fertilizers of ammonia and nitrite that can cause severe seedling injury, especially in dry soil. Avoid fertilizers containing DAP or urea for seed placement and limit to low rates for 2 x 2 placement.
Farm Experience with Starter Fertilizer
Silage corn
Farmers in a Vermont study (1) applied N-P-K starter fertilizer on a total of 12 field sites at rates to supply P2O5 at high (50-60 kg/ha or lb /acre), low (25-30 kg/ha or lb/acre), and zero (no starter applied) rates. All but two sites also received dairy manure for the current season. The yield response to starter fertilizer varied with soil test P and K levels. Three of the six sites with either P or K testing medium (below optimum) showed a significant yield increase whereas only one of the six sites testing optimum in both P and K responded to starter fertilizer. The responsive site received no manure and had the highest aluminum (Al) test level. The low fertilizer rate was adequate on three of the four responsive fields; only one site showed an additional yield increase from the high rate, probably due to low soil K. On the four responding sites, the average yield increase from the low rate of starter fertilizer was over 3 t/ha (1.4 tons/acre) dry matter basis.
Starter response was also related to soil drainage. Two of the three poorly drained sites responded to starter, compared to only two of six for the somewhat poorly drained sites and none of the three well-drained sites. In this study the earliest planting dates were in mid-May and none of the fields had high-residue conservation tillage. Early planting and/or conservation tillage would probably have increased response to starter.
Grain corn
The response of grain corn to starter fertilizer (rate of 10-20-20 kg/ha or 9-18-18 lb/ac) on soils testing high or excessive in P and K was evaluated in 100 on-farm trials in Wisconsin from 1995 to 1997 (2). On average, starter fertilizer increased yield by about 240 kg/ha (4 bu/ac) compared to no starter. An economical response to starter occurred in 30 to 40% of the trials. The probability of a yield response was greater where soil test K was less than 150 ppm (still in the high range) or when long-season hybrids were planted late. The latter point suggests that starter fertilizer had a beneficial effect by hastening crop maturity. In another series of 20 on-farm trials in Wisconsin, the recommended starter rate of 10- 20-20 kg/ha (9-18-18 lb/ac) was compared to the rate used by the farmer, commonly 2-3 times higher. As in the Vermont research above, there was no yield benefit from the higher fertilizer rate.
Researchers in Pennsylvania evaluated starter fertilizer on high-P soils in 35 trials from 1999 to 2001 (3). Results showed the following: a) yield response to starter fertilizer on high P and K soils are usually modest and uneconomical unless the N component offsets some of the total N requirement; b) sometimes most response is obtained with N, K or ammonium sulfate starters, especially where K is low to optimum and N availability is low in the spring; c) pop-up fertilizer is effective where availability of P, K and N is high.
Reduced tillage increased starter response of grain corn in Minnesota and Indiana. The Minnesota trial showed twice the yield response from starter fertilizer with no-till or chisel ploughing (600 kg/ha or 10 bu/ac) compared to mouldboard ploughing (300 kg/ha or 5 bu/ac) (4). In Indiana yield increase from starter was 500 kg/ha (8 bu/ac) under no-till but only 60 kg/ha (1 bu/ac) under conventional tillage (5).
Conclusions from field trial results
Response to starter fertilizer is most likely with:
- Below-optimum soil test P or K
- Soils with poor or limited drainage
- High-residue no-till or reduced tillage
If soil tests are optimum or higher:
- Crop response to starter rates higher than about 10-20-20 units are unlikely (unless high-N starter meets part of the crop N requirement).
- Where N or K availability is limited, more response may be obtained with N, K, or ammonium sulfate starters than from high-P fertilizers.
- A low rate of pop-up fertilizer is a cost-effective alternative.
- Yield response is more likely for long-season hybrids planted late.
References
1. Jokela, W.E. 1992. Effect of starter fertilizer on corn silage yields on medium and high fertility soils. J. Prod. Agric. 5, 233-237.
2. Bundy, L.G. and T.W. Andraski 1999. Site-specific factors affecting corn response to starter fertilizer. J. Prod. Agric. 12, 664-670.
3. Roth, G., D. Beegle, M. Antle, R. Bowersox and S. Heinbaugh 2002. Corn starter fertilizers for high P soils. 2002 Pennsylvania Lime, Fertilizer, and Pesticide Conference. Penn State University.
4. Randall,G.W. and J.B.Swan 1991. Conservation Tillage for Corn and Soybean Production. p.173-177. In A report on Field Research in Soils-1991. Minn. Agric. Expt. Sta. Misc. Pub.71-1991.
5. Brouder, S. 1996. Starter fertilizer for Indiana corn production. Purdue University, West Lafayette, IN. http://www.agry.purdue.edu/ext/corn/pubs/starter.htm
C.A. Grant
Agriculture and Agri-Food Canada, Brandon, MB
Chloride (Cl-) is one of the 16 essential nutrients required for plant growth. In the past, deficiencies of Chloride were generally not expected to occur in the field because the amount of Chloride required by crops is considered very low while a significant quantity of Chloride is normally present in soil, rainfall and irrigation water. However, over the last 25 years, reports of increased crop yield and reduced disease incidence with applications of Chloride have been reported in a wide range of field crops in the Great Plains (Fig. 1) and the Pacific Northwest. The concentration of Chloride in the soil where these responses were observed was well above those where Chloride responses would have been expected, based on the traditional understanding of Chloride requirements in crops. In wheat, yield improvement with Chloride application has been linked to reduced disease damage, accelerated plant development, improved kernel weight, and reduced late-season lodging. Chloride application was shown to reduce leaf tissue nitrate content in wheat (Fig. 2), which could reduce crop susceptibility to disease. Some wheat cultivars appear to be prone to a form of leaf spotting which can be eliminated by application of Chloride.
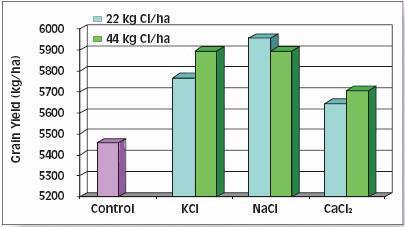
Figure 1. Chloride fertilization increased grain corn yield in Kansas (1).
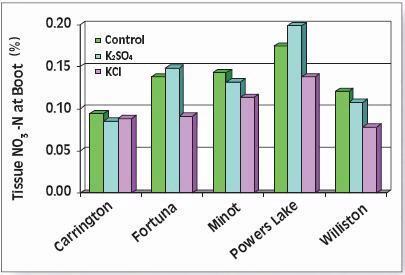
Figure 2. Effect of Potassium source on wheat tissue nitrate (2)
While much of the work in the Great Plains was on wheat and barley, a number of studies have shown that corn can also benefit from Cl- application. New York state research in 1958 (3) demonstrated increased corn yield and decreased stalk rot in corn treated with KCl rather than K2SO4 (Fig 3). Work at Kansas State University (1) indicated that Cl- fertilization could often increase corn and grain sorghum yields and leaf tissue Cl- concentrations, particularly on soils testing less than 22 kg Cl-/ha. Yield responses were most consistent when concentrations of Cl- in the leaves of the check treatments were below 0.10 – 0.15%. The potential for Cl- to improve corn silage quality by reducing tissue nitrate content should be evaluated.
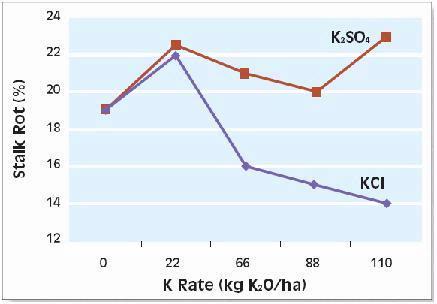
Figure 3. Effect of K source and rate on stalk rot in New York field-grown corn.
References
1. Lamond, R.E., K. Rector and C.J. Olsen 2000. Chloride fertilization for corn and grain sorghum. (http://www.ppi-ppic.org/far/farguide).
2. Timm, C.A., R.J. Goos, B.E. Johnson, F.J. Sobolik and R.W. Stack 1986. Effect of potassium fertilizers on malting barley infected with common root rot. Agron. J. 78, 197-200.
3. Younts, S.E. and R.B. Musgrave 1958. Chemical composition, nutrient absorption and stalk rot incidence of corn as affected by chloride in potassium fertilizer. Agron. J. 50, 426-429.
A.M. JOHNSTON¹ and R. DOWBENKO²
¹ Potash & Phosphate Institute of Canada, Saskatoon, Saskatchewan
² Agrium Inc., Calgary, Alberta
The desirable pH range for optimum corn production is 6.0 to 6.5 (Fig. 1). Soils with a pH 0.2 to 0.3 units below the recommended level should be considered for liming. Liming to maintain an optimum soil pH has several benefits. It reduces the risk of toxicity from aluminum (Al) and other metals, improves the physical condition of the soil, stimulates microbial activity, increases the cation exchange capacity (CEC) in some variable charge soils, increases the availability of several nutrients such as N, P, and molybdenum (Mo), supplies Ca and Mg for plants, and improves symbiotic N fixation by legume rotation crops such as alfalfa and soybeans. Calcitic and dolomitic aglime are the most common lime sources.
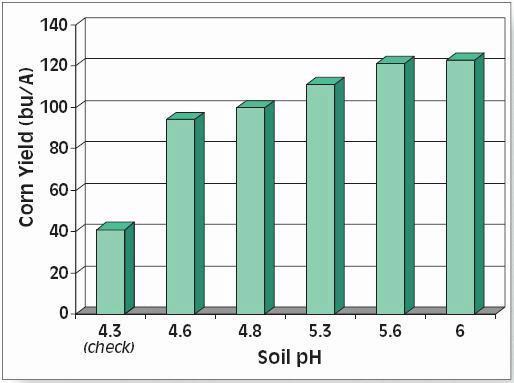
Figure 1. Yield response of corn to soil pH. (From Lathwell and Reid. 1984. In F. Adams, ed. Soil
Acidity and Liming-Agronomy Monograph 12, 2nd Edition. American Society of Agronomy).
As the Ca (and Mg) in ‘aglime’ dissolve in soils, they displace the acidic hydrogen (H+) ions which then react with carbonate in the limestone, ultimately raising soil pH. Note that Ca and Mg do not directly neutralize soil acidity – rather it is the reaction of the H+ ions with the carbonates. This explains why gypsum (CaSO4) has no direct effect on soil pH. The efficacy of a liming material is expressed as calcium carbonate equivalence (CCE), with all liming materials rated in comparison to pure Ca carbonate (CCE=100).
The smaller the lime particle, the faster it will act in soil (Table 1). Pelletized aglime is usually made from aglime ground to pass at least a 70-mesh sieve, which is formed into 5 to 14-mesh pellets with the aid of clay or synthetic binders. Fluid aglime is a 50% mixture of aglime particles, which have been ground to pass a 200-mesh screen, plus 50% water with a small amount of clay or other suspending agent. Both pelletized lime and fluid products are equivalent to good quality aglime. The choice among good aglime, pelletized lime, and fluid lime is often based on cost, uniformity of application, and urgency of raising soil pH.
Table 1. Lime particle fineness affects acidity neutralization.
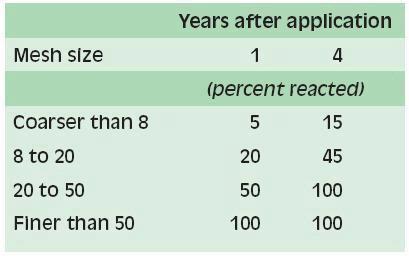
The effective neutralizing value (ECCE) of a liming material can be estimated using the formula:
ECCE = %CCE x 0.50 (% passing 8-mesh + % passing 50-mesh).
Thorough mixing in the tillage zone is also necessary for the optimum lime reaction. Aglime should be incorporated in the entire plough layer before no-till crop production is initiated. Surface liming of no-till systems about every three years, based on soil tests, should be adequate.
D.R. CHADWICK1, S.K.E. BROOKMAN1, J. WILLIAMS2, K.A. SMITH3, B.J. CHAMBERS4, I.M. SCOTFORD5 and T.R. CUMBY5
1Institute of Grassland and Environmental Research, North Wyke Research Station, Okehampton, Devon EX20 2SB UK. 2ADAS Boxworth, Cambridge CB3 8NN UK 3ADAS Wolverhampton, Woodthorne, Wolverhampton WV6 8TQ UK. 4ADAS Gleadthorpe, Nottinghamshire NG20 9PF UK. 5Silsoe Research Institute, Wrest Park, Silsoe, Bedfordshire MK45 4HS UK.
Animal manures contain significant quantities of nutrients that, if managed carefully, can be used to sustain crops and reduce the requirement for inorganic fertilizers. However, it is evident that farmers lack confidence in the nutrient content and availability from animal manures. In order to exploit this resource effectively, farmers and consultants need good quantitative information on nutrient supply from manures. Recent survey data has shown that UK farmers are more likely to trust information that they can gather themselves. Laboratory analyses of animal manures are relatively expensive and there is often a delay of up to 2 weeks in reporting back to the farmer. This time delay is seen as an inconvenience. For these reasons, the development of reliable, rapid and low-cost techniques for the assessment of manure nutrient supply should encourage the uptake of improved techniques for the management and utilization of manure nutrients.
Several on-farm and rapid techniques are available to quantify the nutrient content of manures, e.g. hydrometers, in-line nutrient sensors on slurry tankers, as well as near infra-red spectroscopy (NIRS) and farmer-operated test kits for analysis of the ammonium-N content of manures. In this article, we describe some recent studies assessing the accuracy and reliability of such techniques.
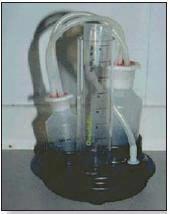
Quantofix meter for testing ammonium-N content in slurry manure.
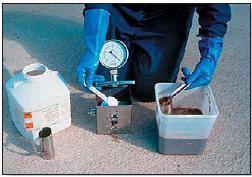
Agros meter for testing ammonium-N content in slurry manure.
Ammonium-N test kits
In a comparative study of on-farm ammonium-N (NH4-N) tests, we determined the accuracy of five different techniques, namely: Agros and Quantofix nitrogen meters, reflectometers, and conductivity and selective ammonium electrodes. The techniques were tested under laboratory conditions on 40 slurry, 25 farmyard manure (FYM) and 20 poultry manure samples from commercial units. The results obtained from each method were compared with those from standard laboratory analysis techniques for measuring NH4-N concentrations. There were strong relationships (P)
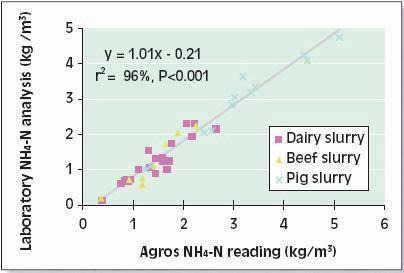
Figure 1. Relationship between Agros estimates of slurry NH4-N content and laboratory analyses.
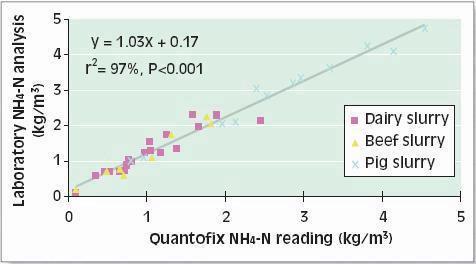
Figure 2. Relationship between Quantofix estimates of slurry ammonium-N (NH4-N) content and laboratory analyses.
The conductivity electrode and reflectometer generally gave good agreement with the laboratory results for NH4-N, but the strength of the relationships varied according to animal slurry type (r2 >80% for pig slurry; >60% for cattle slurry). The relationship between the ion specific electrode and laboratory analysis of NH4-N was not linear but exponential, which resulted in problems when estimating slurry NH4-N at high concentrations. The readings also tended to drift with time, which made it difficult to decide on the ‘correct’ value.
The most successful techniques in the laboratory (N meters, conductivity meter and reflectometer) were tested by 16 farmers to assess their suitability for use on-farm. The on-farm slurry tests showed that the farmers could also obtain good agreement with the laboratory NH4-N analysis results with both nitrogen meters (the Agros and Quantofix) and the conductivity meter. However, the reflectometer was assessed as ‘impractical’ for on-farm use. The robust construction, simple operation and accuracy of the nitrogen meters meant that they were very suitable for on-farm use and were available for purchase in the market place. The simple mode of operation and ‘instant’ readout provided by the conductivity meter was also popular with the farmers, but a marketable product was not available for purchase by farmers at the time.
Hydrometers
Slurry dry matter content is a useful indicator of nutrient content, particularly P content (Fig. 3). A commercially available, calibrated glass hydrometer was used to assess slurry dry matter content. In the laboratory assessments, there was a strong relationship between the hydrometer readings and laboratory measurements of slurry dry matter content (P)
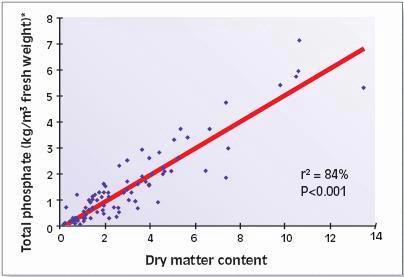
Figure 3. The relationship between cattle slurry dry matter content and slurry phosphate content. * kg/m3 = 0.1%
In-line sensors
Automatic in-line nutrient sensing offers greater convenience to farmers and contractors compared with approaches based on manual sampling. For example, nutrient estimates are in realtime, and sampling errors are reduced since the method analyzes and records the nutrients in all of the slurry being spread load-by-load; thus complete mixing of stored slurry to obtain representative samples is unnecessary. Initially, this approach was developed in the UK as a small-scale prototype incorporating a combination of standard industrial sensors to measure a set of physical and chemical properties of the slurry. The measured properties of the slurry were electrical conductivity, ammonium ions, density, temperature, differential pressure, flow, pH and redox. This device was used to assess 160 different pig and cattle slurries in 4 European Countries. Each slurry was analyzed for NH4-N, total phosphorus (TP) and total potassium (TK) using conventional laboratory techniques. The output data from the individual sensors were compared with the laboratory values, and statistical correlations were identified from these data sets by linear regression analyses. Hence, algorithms were identified to relate the physical and chemical properties of the slurries to their NH4-N, total P and total K concentrations. NH4-N concentrations were related to the electrical conductivity of the slurry, P was related to slurry density and K related to ammonium ion concentrations.
Based on the promising results obtained from the smallscale prototype, a full-scale version of the in-line slurry nutrient sensing system was constructed with sensors fitted in the side of a 7 m3 (2000 gal) slurry tanker. Thus, as the slurry was mixed by recirculation in the tanker, the slurry properties could be measured and converted to nutrient concentrations in real-time by a computer using the previously derived algorithms. This system estimated the NH4-N, total P and total K to respective accuracies of +/-0.29, +/-0.29 and +/-0.79 kg/m3. The respective ranges over which these values were determined were 0.63 – 5.29 kg/m3; 0.12 – 0.71 kg/m3 and 0.81 – 6.49 kg/m3. Further developments to include global positioning systems (GPS), enhanced data management and in-line systems for solid manures are envisaged.
Solid manures
For solid manures, it would appear that analysis by near infra-red spectroscopy (NIRS) could be a promising approach to quantify several nutrients. This technique has been tested on a limited number of solid manure samples in the UK. NIR spectrophotometer calibration equations for organic matter, dry matter, total N, NH4-N and uric acid-N showed good correlations and low standard errors of calibration. Preliminary validation experiments were undertaken on further manure samples, which gave encouraging results for all the analytes, with the exception of pH, suggesting that it should be possible to develop NIRS into a routine technique. Sample introduction to the NIRS is known to be a critical factor influencing accuracy. Therefore, in a new study, a robust homogenization procedure is being developed.
A potential advantage of using NIRS over conventional laboratory techniques is the use of larger sample size. Also, the rapidity of analysis and potentially lower costs mean that a greater number of samples can be analyszed per unit cost. These advantages mean that analysis can be carried out on a more representative sample of the manure.
Robust and accurate on-farm and rapid tests are available, or are in the process of being developed. However, if the samples being analysed are not representative of the manure supply, then the farmer is not going to make most efficient use of the manure nutrients. A current study in the UK is assessing improvements to sampling protocols for slurry stores and solid manure heaps.
Hydrometers, Agros and Quantofix meters are available from:
- Managro Harvestore, Headingly, Manitoba — dschmidt@managro.com
- Sylvette Corp., Minneapolis, Minnesota — www.sylvette.com
- Qualex Limited. 51 Dauntsey, Chippenham, Wiltshire SN15 4HN UK.
- Rekord Sales (G.B.) Ltd., Manor Rd, Mancetter, Atherstone, Warwickshire. UK
- Martin Sykes, Cwm Wyntell, Letterston, Dyfed. UK
- Or go to: www.agros.se/representation.html
K. BUCKLEY AND M. MAKORTOFF
Agriculture and Agri-Food Canada, Brandon, Manitoba
Phosphorus (P) plays a key role in growth of bones and teeth and in energy processes in livestock. Producers provide supplemental P to their stock to ensure that performance is not hindered by deficiency. The nitrogen (N) to P ratios in manures can vary widely (Table 1) and, in most cases, tend to have narrower values than the uptake ratios of plants (4.5:1 to 9:1), in part due to over-supplementation of P in livestock diets. The imbalance between the N:P ratio in manure and that in crops is made worse by losses in ammonia-N from manure, leading to excessive P in the soil if application rates of manure are based on N requirement.
Table 1. Range of ratios of N:P in different sources of manure (1).
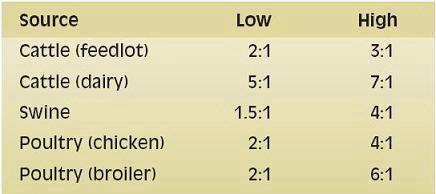
The proportion of various P forms in manure is influenced by species and age of livestock, diet, bedding type and method of manure handling. Phosphorus occurs in animal manure in a combination of inorganic and organic forms. In general, 45 to 90 percent of manure P is inorganic and the rest is considered to be organic P. Much of the organic P is easily decomposable by soil microorganisms to the inorganic form. Factors such as temperature, soil moisture, and soil pH affect P mineralization rate.
Some of the inorganic P is water soluble which makes it very mobile and thus susceptible to runoff in surface waters. Although water soluble P is the most available form, labile P, which is the next most available form, is easily liberated to be taken up by the plant. This form is often referred to as the bicarbonate-extractable inorganic and organic P found in manure. The third most available form of P is the sorbed inorganic and organic P that is characterized by its solubility in sodium hydroxide solution. The most recalcitrant form of P, is acid-extractable and generally exists in a stable residual form in the soil. There have been few studies to compare the manures of different animal species in terms of extractable forms (2, 3). In one such study (2), researchers noted that the highest concentration of total P per kg of manure was in swine slurry, followed closely by poultry and then dairy which had almost ten times less total P per kg of manure (Table 2). On the other hand, dairy manure contained the greatest proportion of the inorganic water soluble form of P, relative to the other species of livestock. In poultry manure, the largest portion of P was found to be in the acid-extractable or most stable form, whereas in the swine slurry, the greatest portion of P was found to be in the inorganic hydroxide extracted P form. Since these forms have different plant availabilities, it could be inferred that dairy manure amended soil would have proportionately higher amounts of the readily available P form compared to swine manure amended soils. Likewise the labile P, which is relatively more abundant in poultry manure than other manures would be available for plant uptake. The abundance of the readily available forms of P in dairy and poultry manure should be considered when planning applications in areas where water quality may be at risk due to topographical limitations.
Table 2. Inorganic and organic P fraction concentration and percentages in dairy, poultry and swine manures (3).
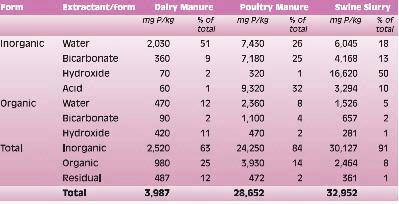
Swine and poultry manure contains more acid-soluble P than cattle manure (Table 2). This is thought to occur because swine and poultry produce very little of the phytase enzyme required to utilize phytate-P in grain (2). In contrast, cattle generally produce sufficient phytase, although the amounts vary with age and health, which leads to fluctuations in acid-soluble P in the manure. Furthermore, ruminants are fed different amounts of grain depending on seasonal forage availability, whereas a non-ruminant diet consists primarily of grain. Most water-soluble organic P in manure is in the phytate form with smaller amounts as pyrophosphate (3, 4). Increasing the storage time of swine manure decreases phytate content, liberating the P to be mineralized to a more available form (5). Similarly, increasing the storage time of cattle manure also increases the ratio of inorganic to organic P, raising the concentration of water soluble-P (6).
Diet has the greatest effect on form and amount of phosphorus in manure of all classes of livestock. In cattle, excess P increases the amount of total and inorganic P excreted as well as the proportion of water-soluble P (6). Generally, most of the excreted P can be found in the feces of sows and finisher pigs. Sows, the category of swine more likely to receive this mineral in excess, may excrete 32% of ingested P as soluble P via the urine while only 10% of P intake may be excreted in the urine of finisher pigs (7).
Manure of all species can be treated with elemental salts (aluminum sulfate, aluminum choride, ferric choride, calcium sulfate, fly ash or synthetic polymers) to precipitate soluble P and reduce the risk of P runoff. There is a concern, however, that this process may cause secondary environmental pollution by raising the concentrations of chlorides and sulfates in soil.
References
1. Egball, B. 2003. Phosphorus and nitrogen based manure and compost application. http://manure.unl.edu/v2n9_96.html.
2. Barnett, G.M. 1994. Phosphorus forms in animal manure. Biores. Technol. 49, 139-147.
3. Sharpley, A.N. and B. Moyer 2000. Phosphorus forms in manure and compost and their release during simulated rainfall. J. Environ. Qual. 29, 1462-1469.
4. He, Z. and C.W. Honeycutt 2001. Enzymatic characterization of organic phosphorus in animal manure. J. Envir. Qual. 30, 1685-1692.
5. Dou, Z., K.F. Knowlton, R.A. Kohn, Z. Wu, L.D. Satter, G. Zhang, J.D. Toth and J.D. Ferguson 2002. Phosphorus characteristics of dairy feces affected by diets. J. Environ. Qual. 31, 2058-2065.
6. Joern, B.C., T.L. Provin and A.L. Sutton 1996. Retention of swine manure phosphorous compounds in soil. 1996 Research Investment Report. http:// www.nppc.org/Research/”96Reports/”96Joern-phosretention.htm
7. Poulsen, H. D., A.W. Jongbloed, P. Latimier and J.A. Fernandez 1999. Phosphorus consumption, utilisation and losses in pig production in France, The Netherlands and Denmark. Livestock Prod. Sci. 58, 251-259.
B. BALL COELHO¹ and R.C. ROY²
Agriculture and Agri-Food Canada, ¹ London and ² Delhi, Ontario
Pros and Cons of Injecting Liquid Manure
The poor response of crops to surface-broadcast manure can be attributed to losses of nutrients by surface runoff (N and P) and volatilization (N) of nutrients and to low root activity near the soil surface when it is dry. While injection of liquid manure reduces runoff, volatilization of ammonia and odour, it requires increased horsepower and application time, and costly equipment. Injection can be difficult where there is a lot of residue and may leave soil surfaces rough for no-till planting. The disturbed surfaces left by some injection systems leaves these soils exposed to wind erosion. On some soils there is a risk that contaminants from injected manure will move directly into tile drains and surface waters.
In our trials in Ontario, yield of (grain) corn was similar whether N was supplied by inorganic fertilizer or by pre-plant injected liquid hog manure (Fig. 1). Note that we did not plant corn directly into the injection zone to avoid risk of salt injury although a separate trial showed that this was unlikely to occur. All plots received 5 kg P2O5/ha (4.5 lb P2O5/ac) in the seed furrow.
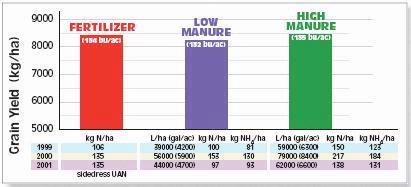
Figure 1. Corn grain yields (1999–2001) with inorganic fertilizer (sidedressed UAN) were similar to pre-plant manure injected at 2 rates. The fertilizer and low manure rate treatments received 40 kg N/ha (36 lb/ac) with the planter. (lb/ac = 0.9 kg/ha)
Nitrate Leaching from Injected Manure on Coarse-Textured Soils
Since conservation tillage is often practised successfully on sandy soils, manure injection systems are needed for these fields. Since these soils are prone to leaching of nitrate, especially where the water table is shallow, special caution must be practised when injecting manure.
In Ontario, nitrate leaching occurs most commonly after the fall corn harvest and in the following spring. Fall leaching can be minimized by avoiding over-applying manure and using cover crops (see Cover Cropping to Manage Residual Nitrogen section). However, in wet years nitrate can leach into groundwater in the weeks after application, even if the manure is injected just before planting in order to synchronize nitrate availability to the demand for N by the crop. For example, continuous rains in June and July of 2000 caused leaching of nitrate from applied manure below the crop root zone (1.5 m deep). It is important to note that more leaching was observed with pre-plant injected manure than sidedressed fertilizer N (urea ammonium nitrate, UAN) (Fig. 2) because more ammonium had been converted to nitrate from manure which had been applied several weeks before the sidedressed fertilizer. Splitting manure applications between preplant and sidedress times would minimize risk of nitrate leaching on sandy soils.
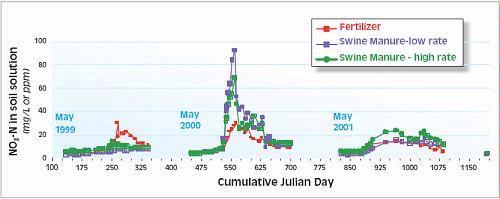
Figure 2. Nitrate concentration in the soil solution below the root zone (1.5 m or 5 ft) after injecting swine manure before planting or sidedressing inorganic N fertilizer, in two dry and one (2000) wet year (Norfolk County, ON)
Risk of nitrate movement to groundwater is lower in loamy than in sandy soils, so pre-plant injection of manure may be done more safely on loams. When manure was injected into the tillage band (zone tillage) before planting, yield of corn was equivalent to conventional tillage with starter fertilizer. Manure injected in the fall, however, did not provide appreciable N in spring following a winter with frequent thaws but did provide some N after a colder winter with more snow cover. Note that in some regions, where over-winter leaching potential is high, applications of manure or fertilizer to bare land in the fall is not recommended or allowed. There was no evidence of salt injury from planting into the manure injection zone, but this could be a concern in some situations.
Can the PSNT be used in previously manure-injected soils?
After manure is applied prior to planting, soil nitrate concentration increases gradually as the ammonia in the manure converts to nitrate (process called nitrification), peaking typically just before sidedress time (Fig. 3). The release of N from pre-plant injected hog manure coincides fairly well with the demand of the corn crop. In our trials, the so-called ‘late PSNT’ (sampled a few days before sidedressing) correctly in-dicated that little additional N was required for manured plots whereas earlier soil testing would have incorrectly predicted a requirement of 100 to 200 kg N/ha (90 to 180 lb N/ac) (see Spring N Tests section). Over all trials on loam soils, the PSNT correctly indicated the need for sidedress N in 80% of cases in Huron County (1999) and 93, 100 and 76% of cases in Perth County (2000, 2001 and 2002, respectively). Critical values for PSNT (beyond which yields did not increase with more sidedress N) were 50 kg nitrate-N /ha (45 lb/ac) in Huron County in 1999 and 80 kg nitrate-N /ha (72 lb/ac) in Perth County in 2000.
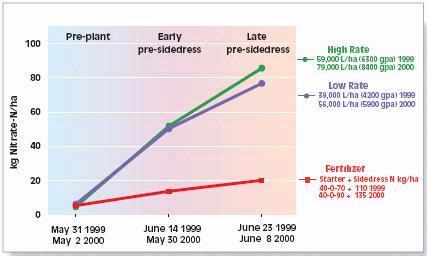
Figure 3. Pre-plant and pre-sidress soil nitrate tests with inorganic fertilizer or liquid swine manure at 2 rates, Norfolk County, Ontario. Average of 2 years. Pre-plant injection was May 29, 1999 and April 27, 2000.
The location of soil samples relative to the manure injection bands is crucial. We found that if one in three ‘late PSNT’ samples was collected from within the manure injection bands and the remainder between bands, about 61-73% of the NH4-N applied in the manure was detected as NO3-N in soil (Fig. 3). We therefore conclude that carefully taken late PSNT samples are useful for soils that have received injected liquid hog manure.
Sidedressing with Liquid Swine Manure
On fine-textured soils, some corn growers find pre-plant application of manure inconvenient because the soil is too wet prior to planting to pull heavy equipment without causing compaction. On these soils, and where tile drains increase the risk of contamination of surface waters, applying some or all of the manure at sidedress may be a better strategy than applying all the manure before planting. In Ontario, sidedressing of manure can be done from 4-6 leaf stage (Fig. 4) until about the end of June (Fig. 5). Generally good corn yields have been observed with sidedressed swine manure using a a 6-row injector mounted on a tank (Nuhn Industries, Sebringville, Ontario) (Figs. 4 and 5). Even narrow-row corn can be sidedressed, for example using a tank with narrow, tandem duals and an 11- row injector.
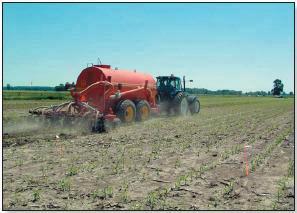
Figure 4. Sidedressing corn with liquid swine manure, 19 June 2002, Perth County, ON. Flow control was used to control rate of application.
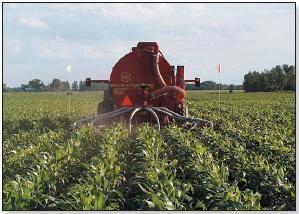
Figure 5. Sidedressing corn with liquid swine manure, June 30, 2000, Perth County, Ontario.
In-tank mixing is important for uniform nutrient delivery and flow control helps to adjust application rates at appropriate ground speed. Flow control (Green Lea Ag Centre, Mt Elgin, Ontario) can be used for accurate application rates and convenience of changing rates according to variability in soil nitrate tests, crop yield potential, field history or other factors. It is better to regulate application rates by adjusting flow control than tractor speed. Less calibration is required and optimum ground speed can be maintained. And no one likes to slow down! Coupled with GPS and appropriate software, the system can provide records for nutrient management plans and demonstration of due diligence during manure application. The digitized maps can illustrate rate of application and any set-backs from water courses, etc.
Application rates of liquid swine manure to assure 95% maximum corn yields averaged 50,000 L/ha (5,300 gal/ac) over 1999 to 2002. We tested two methods of sidedressing the manure: injection and in-lay (or topdress). We found that method had little effect on results when application was relatively late (Fig. 6). However, when corn was sidedressed earlier in dry growing seasons (2002), injection out-yielded topdress by up to 3,100 kg/ha (50 bu/ ac) (Fig.7). Also, concentration of N in the grain tended to be higher when manure was injected than when topdressed. Inconsistency in N availability from surfaceapplied sidedress manure is due to variations in N volatilization, runoff and surface root activity due to differences in soil moisture.
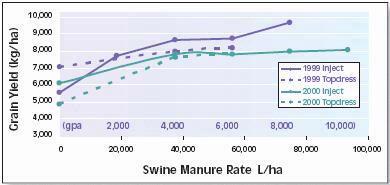
Figure 6. Corn yields (grain) with different rates and methods of sidedressing swine manure (1999: Huron County, 51 cm or 20 in-corn rows, no-till; 2000: Perth County, 76 cm or 30 in-corn rows, conventional till).
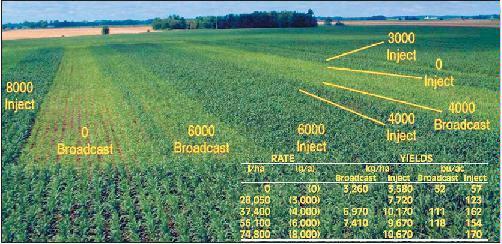
Figure 7. Corn responds to rates and methods of sidedress manure, Perth County, 2002. Values on treatment plots application rates in gal/ac.
Nutrient Movement to Tile Drains
Injection of manure can increase movement of contaminants into tile drains, which occurs due to ‘by-pass’ flow through cracks and channels in the soil. In a trial in Perth County, ON, movement of manure to tiles, as indicated by an increase in phosphate concentration, occurred with injection rates above 56,000 L/ha (6000 gal/ac) (Fig. 8). Note that tile water became contaminated very rapidly after manure application (inset, Fig 8). At low rates, sidedress-injected manure containing more than 0.4% N supplied sufficient nutrients for a corn crop. Although less manure is likely to flow into tiles in soils with relatively small worm (night crawler) populations, manure rates in excess of crop requirement should be avoided to minimize residual nitrate concentrations in soil (Fig. 9) since leftover nitrate will move into tile drainage water in fall and the next spring. To minimize movement of contaminants to tile drains, manure should be applied at drier times of the year when tiles are less likely to be flowing. Also, injection equipment that provides sufficient mixing should be employed (see below). In porous loams, application rates should not exceed 56,000 L/ha (6000 gal/ac) whereas in cracking clays, special caution is required at even low application rates to avoid movement of manure.
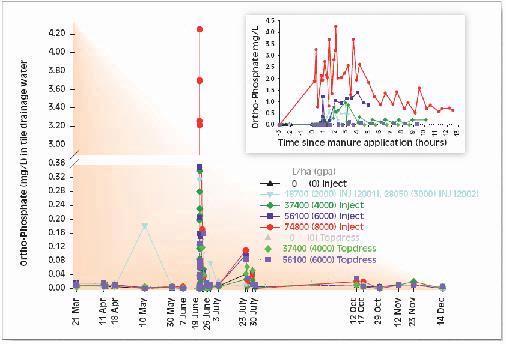
Figure 8. Phosphate concentration in tile drainage water increases following high rates of manure application, Perth county. Average of 2 years (2001 & 2002).
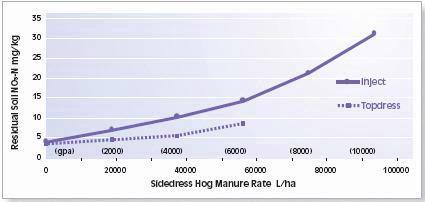
Figure 9. Residual nitrate concentrations in the topsoil after corn harvest increase with sidedress rate of swine manure. Three-yr average from trials in Huron (1999) & Perth (2000 & 2001) Counties, Ontario.
Injection Equipment for Reduced Tillage
The Yetter Avenger injector (Yetter Farm Equipment, Colchester, Illinois) performs well in high residue fields and leaves the soil surface smooth enough for planting (Fig.10). Optional sealing discs and press wheels which are attached to the scraper blade in front of the drop tube, help to close the injection trench. At application rates exceeding 56,000 L/ha (6000 gal/ ac), ‘wings’ are needed to ensure that all the manure remains below the surface.
The Vibra Shank (Kongskilde Limited, Exeter, ON) can be used in minimum till (Fig. 11) but may leave a rough surface by throwing root clumps, particularly when injecting over old corn rows. Coulters (Ag Systems, Hutchinson, Minnesota) can be added to help manage high residue and increase soil mixing (Fig. 12). Disc hillers (Fig. 13) can be added to prevent preferential flow of rainwater down the injection slot (Nuhn row crop injector, Nuhn Industries, Sebringville, ON). This helps reduce leaching of nutrients and other contaminants, particularly in heavier soils where the injection knives tend to leave open slots. Hillers also allow shallower injection while still keeping manure covered, helping to minimize contaminant movement both to tile drains and by surface runoff. Hillers also leave a good seed bed for planting into the injection zone in conservation tillage systems (Fig. 14). The raised berm provides a good seed bed which warms more quickly in spring promoting faster germination. In contrast the trenches left by injection warm slowly. Using an aggressive injector with the disc hillers, both zone tillage and manure application can be carried out in one pass, a procedure which has come to be called ‘zone-jection’.
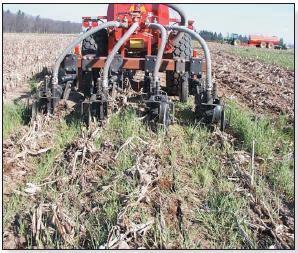
Figure 10. Pre-plant manure injection (Yetter Avenger) into no-till corn residues and overseeded cereal rye cover crop.
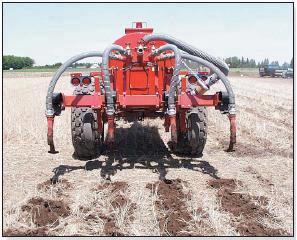
Figure 11. Kongskilde Vibra Shank used for pre-plant manure injection (into killed rye rotation crop) in an experiment conducted in sandy soil in 1999.
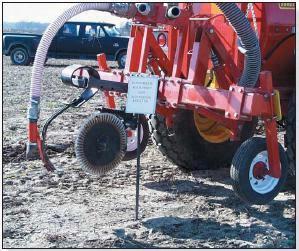
Figure 12. Kongskilde Vibra Shank equipped with coulters for residue handling and increased soil mixing.
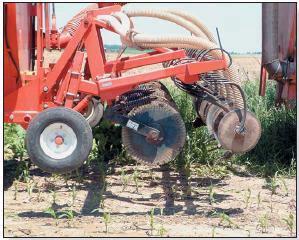
Figure 13. Vibra Shank equipped with coulters and hillers (Nuhn row crop injector) to cover manure and create a berm.
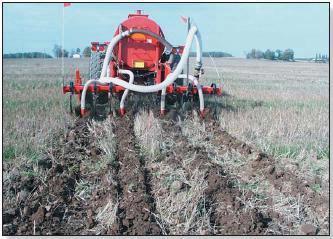
Figure 14. Fall injection into wheat stubble with Nuhn row crop injector (coulters + injector + hillers) for planting the subsequent corn crop in the tilled zone.
To determine what type of injection tool allows the least manure to run into tile drains after application, red dye was injected through the applicators, then trenches were dug the next day to expose dye patterns. This study revealed that injected manure can seep through worm holes, bypassing the soil matrix that would otherwise filter out the contaminants (Fig. 15). Manure applied with deep injectors such as the ‘rigid tooth with 25 cm (10 in.)- sweep’ and the Yetter Avenger was prone to leaching through worm channels. In contrast, injection tools which work manure into the topsoil reduce the chance of manure intersecting with worm holes (Fig. 16). Two examples of this type of implement include the Vibra Shank plus coulter, and the Zone Tiller (developed by Agriculture and Agri-Food Canada) which consists of a DMI shank (DMI, Goodfield, Illinois), a coulter and a hiller made from an adjustable fluted coulter.
To determine what type of injection tool allows the least manure to run into tile drains after application, red dye was injected through the applicators, then trenches were dug the next day to expose dye patterns. This study revealed that injected manure can seep through worm holes, bypassing the soil matrix that would otherwise filter out the contaminants (Fig. 15). Manure applied with deep injectors such as the ‘rigid tooth with 25 cm (10 in.)- sweep’ and the Yetter Avenger was prone to leaching through worm channels. In contrast, injection tools which work manure into the topsoil reduce the chance of manure intersecting with worm holes (Fig. 16). Two examples of this type of implement include the Vibra Shank plus coulter, and the Zone Tiller (developed by Agriculture and Agri-Food Canada) which consists of a DMI shank (DMI, Goodfield, Illinois), a coulter and a hiller made from an adjustable fluted coulter.
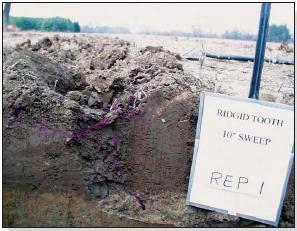
Figure 15. Movement pattern as shown by dye with injection using a 25 cm (10″)-sweep on a rigid tooth. Material is put down in layer which can intersect worm holes and move deeper.
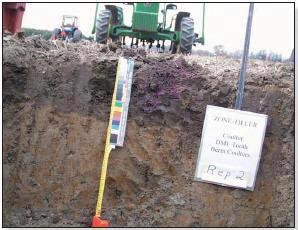
Figure 16. Movement pattern as shown by dye with injection using the AAFC-Delhi Zone Tiller (consists of coulters + DMI shank + berm coulters), illustrates more mixing of material in the topsoil.)
Acknowledgements: Ontario Pork, Nuhn Industries, Green Lea Ag. Centre, A & L Laboratories, OMAF, DeKalb, Logan Tractor, Da Costa Farms, Van Raay Farms, Bloxslea Farms, T. Groenestegue, K. Otto, V. Hulsof, AAFC Technical Staff and Delhi Farm Crew.
Advantages of sidedressing manure include:
- risk of not getting manure applied if May and June are rainy;
- yield losses on headlands;
- matching row length to tank volume to avoid driving empty. Some growers re-orient rows to better match applicator capacity. Additional roadways and headlands may be needed for large fields.
Disadvantages of sidedressing manure include:
- reduced movement of ammonium, phosphate, pathogens and other contaminants to surface waters via tile drains because crop roots are actively absorbing nutrients, and tiles are less likely to be flowing than earlier in the season;
- better N-use efficiency;
- reduced compaction because the soil is probably drier; PSNT can be used.
T. MISSELBROOK
Institute for Grassland and Environmental Research, North Wyke, UK
Ammonia loss
Most of the readily available nitrogen (N) in solid manure from pigs and cattle (called farmyard manure or FYM) is in the ammonia form. In contrast, readily available N in poultry litter is in the uric acid form, but uric acid can be converted to ammonia fairly rapidly in the soil. The content of readily available N in solid manure will depend on factors such as animal diet, amount and type of bedding, storage period and storage method. For example, compacting and covering manure heaps reduces loss of ammonia during storage. Also, extra bedding is thought to ‘lock-up’ the available N, reducing ammonia emissions from both housing and storage (1). In contrast, actively composting FYM by turning will promote ammonia losses during storage (2) so that very little readily available N is left.
Proportions of readily available N lost as ammonia after applications on the land are typically greater for solid manures than for slurries (Fig. 1) because solid manures cannot infiltrate the soil. Since solid manures contain less available N, less ammonia is lost per unit of applied manure. The amount of ammonia loss for a given application will depend on weather conditions and manure characteristics. In the UK, losses after application averaged 70% of available N from solid cattle or pig manure and 50% of available N (ammonia-N and uric acid N) from poultry manures (3).
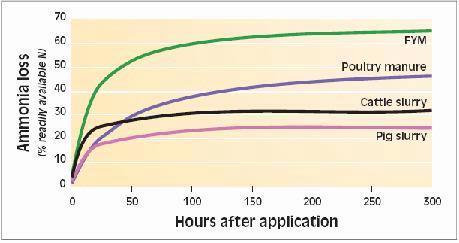
Figure 1. Typical cumulative ammonia emission curves for different manure types.
Losses of available N from slurry and solid manures after land application tend to occur over a longer time period from poultry manure than from other livestock manures because the N cannot be lost until uric acid is converted to ammonia (Fig. 1). Therefore, about half the available N is lost within 6-12 h after field applications of solid cattle and pig manures but not until 40 h after application for solid poultry manure.
For solid manures, the only practical measure to reduce ammonia losses after spreading is to
incorporate the manure into the soil. Since much of the emission occurs in the first few hours after spreading, rapid incorporation is essential. The abatement achieved will depend both on the method of incorporation (e.g. plough, rotary harrow, disc or tine) and the speed of incorporation. Few measurements have been made on incorporating solid manures, but Fig. 2 gives an example of the reductions that may be achieved for slurries. Note that a fast but less efficient incorporation tool, such as the tine, may give a better overall reduction in emission if it keeps pace with the spreading operation compared to a more efficient tool, such as the plough, operating several hours behind the spreader (5).
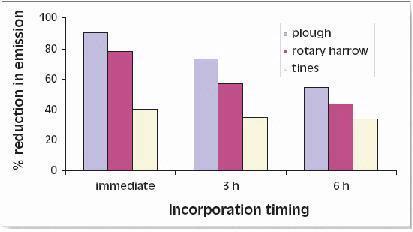
Figure 2. Reduction in ammonia emission from pig slurry applications to arable land for different incorporation methods and timing (4).
N availability from solid manures
When crop yield response is due to the readily available N content of the manure applied, methods that reduce losses from housing, storage and land application will improve availability of N for the next crop. Some of the organic N may also become available during the growing season and in subsequent seasons. The availability of the organic N for crops is related to the ratio of carbon to organic N in the manure (6), decreasing for higher carbon content materials (Fig. 3).
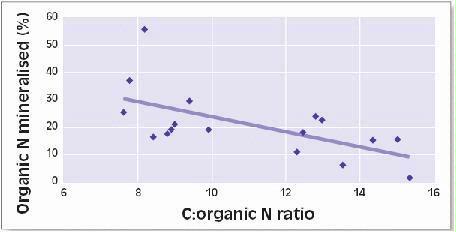
Figure 3. Effect of ratio of carbon to organic N on mineralization of N in manures
Typical analyses of solid manures and their availabilities to crops are given in Table 1. Stored cattle FYM has a lower available N content than that spread fresh from the house, as some N will be lost during storage through ammonia volatilization and leaching, and some available N will be immobilized. Since there will be some loss of mass during storage in addition to N loss, the concentration of total N in stored and fresh FYM will be about the same. Poultry manures have a higher proportion of available N because of the presence of uric acid in addition to ammonia. Actual analysis of solid manure from individual farms can vary greatly, depending on diet, bedding type and amount, storage method and duration, so it is recommended that a representative sample of the manure is analysed at the time of spreading.
Table 1. Nitrogen content and availability for several solid manures (7)
|
Manure Type |
Total N |
Available N |
% of total N available to next crop |
||
|
|
(kg/t) |
(%) |
Autumn application |
Spring |
Spring |
|
Fresh Cattle FYM |
6.0 |
25 |
5-10 |
20 |
25 |
|
Stored Cattle FYM |
6.0 |
10 |
5-10 |
15 |
20 |
|
Broiler Litter |
30 |
40 |
10-20 |
30 |
45 |
|
Layer Manure |
16 |
50 |
10-20 |
35 |
50 |
The amount of N that will be available to a crop after manure application depends on the time and method of application. For autumn applications, the majority of the available N will be lost through ammonia volatilization soon after application and by nitrate leaching over the autumn/winter period. Note that in regions where winter leaching potential is high, authorities do not recommend or even allow manure applications on bare land in fall or winter. Nitrogen available for the next crop will predominantly come from mineralization of the organic N. Following spring application, the most important N loss will be via ammonia volatilization. Therefore, incorporation of the manure within 24 h of application will increase the proportion of N available for crop uptake.
References
1. Chadwick, D.R., R. Matthews, R.J. Nicholson, B.J. Chambers and L.O. Boyles 2002. Management practices to reduce ammonia emissions from pig and cattle manure stores. IN: RAMIRAN 2002, 10th International conference J. Venglovsky and G. Greserova (eds.), Strbske Pleso, Slovak Republic, pp. 219-222.
2. Parkinson, R., P. Gibbs, S. Burchett and T. Misselbrook 2004. Effect of turning regime and seasonal weather conditions on nitrogen and phosphorus losses during aerobic composting of cattle manure. Bioresource Technology 91, 171- 178.
3. Misselbrook, T.H., D.R. Chadwick, B.J. Chambers, K.A. Smith, J. Webb, V.R. Phillips and R.W. Sneath 2002. Inventory of ammonia emissions from UK agriculture, 2001. Report to UK Department for Environment, Food and Rural Affairs.
4. Pain, B.F., V.R. Phillips, J.F.M. Huijsmans and J.V. Klarenbeek 1991. Anglo- Dutch experiments on odour and ammonia emissions following the spreading of piggery wastes on arable land. IMAG_DLO Report 91-9, Wageningen, Netherlands
5. Huijsmans, J.F.M. and R.M de Mol 1999. A model for ammonia volatilization after surface application and subsequent incorporation of manure on arable land. Journal of Agricultural Engineering Research 74, 73-82.
6. Chadwick, D.R., F. John, B.F. Pain, B.J. Chambers and J. Williams 2000. Plant uptake of nitrogen from the organic nitrogen fraction of animal manures: a laboratory experiment. Journal of Agricultural Science, Cambridge 134, 159- 168.
7. Anon 2000. Fertiliser recommendations for agricultural and horticultural crops. Ministry of Agriculture Fisheries and Food, Reference Book 209. 7th Edition. London: The Stationery Office.
W.E. JOKELA
Plant and Soil Science Dept., University of Vermont,Burlington, Vermont
Livestock manure provides significant benefits for soil health and crop nutrient supply, however, it can also contribute to a range of environmental problems. In fact, well-managed manure can meet most, if not all, of the nitrogen (N) need of a corn crop. Many farm systems have manure that is solid or semi-solid (see Using Solid Manures section). A field study in Vermont (1), conducted on a moderately welldrained loam soil, compared the spring applications of semisolid dairy manure at 55 t/ha (25 T/ac) that was incorporated the same day by mouldboard ploughing or left on the surface without tillage (Fig. 1). Two-year aveage corn silage yields showed a 4 t/ha (1.8 T/ac) yield increase from manure incorporated with mouldboard tillage (MB+M) and no additional increase from fertilizer N. The non-manured treatment required 50 to 100 kg/ha of N to achieve top yields. Chisel plough treatments were found to be similar to the mouldboard treatments.
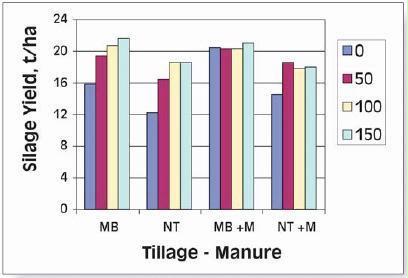
Figure 1. Whole-crop corn yields (dry matter basis) as affected by combinations of manure (none and manure at 55 t/ha), tillage and rates of N fertilizer in kg/ha (lb/ac). Note that all treatments received 22 kg/ha (20 lb/ac) starter N. (For T/ac, multiply t/ha by 0.45)
Conserving ammonia by timely tillage translates into increased yields. In the Vermont study (Fig. 1), dairy manure incorporated by ploughing within a few hours of application, supplied adequate N for a 20 t/ha (9 T/ac) corn silage crop. However, when the same manure rate was surface-applied in the no-till system, an additional 55 kg/ha (50 T/ac) of fertilizer N was needed.
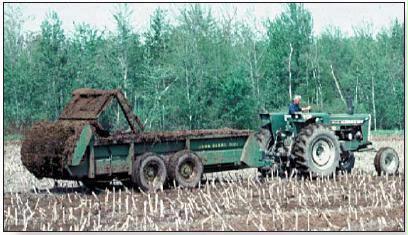
Reference
1. Jokela, W.E., F.R. Magdoff and D.S. Ross 1989. Tillage, manure and N fertilizer effects on corn silage yield and nitrate leaching potential. P. 243. In Agronomy Abstracts, ASA, Madison, WI.
W.E. JOKELA¹ and J.J. MEISINGER²
¹ Plant and Soil Science Dept., University of Vermont, Burlington, Vermont
² USDA-ARS, Beltsville Agric. Research Center, Beltsville, Maryland
Maximizing crop utilization of manure nitrogen (N) requires careful management to minimize N losses. Manure N can be lost by several processes — nitrate leaching, denitrification, and runoff of N (see The Nitrogen Cycle section). The process that has the potential for the greatest N loss from manure — and the one most readily controlled by management — is ammonia volatilization. Besides the obviouseconomic loss requiring replacement with purchased fertilizer N, there are the environmental concerns of deposition of ammonia contributing to eutrophication of surface waters (especially marine and estuarine), accelerating soil acidification, and loss of species diversity (1). Ammonia in the atmosphere can also form fine particulates that reduce air quality (see The Nitrogen Cycle section). Further, the decreased amount of available N left in manure reduces the N:P ratio and leads to more build-up of P in the soil for a given amount of available N (see Phosphorus in Livestock Manure section).
For solid manures, direct tillage into the soil is the main avenue for incorporation, but for slurries there are various other application options for conserving ammonia. A number of equipment and management options are available for controlling ammonia loss from manure applied to cropland, most aimed at quick incorporation of manure via tillage or injection. The particular management choice will depend on the circumstances of the individual livestock producer. Adopting manure management practices that conserve ammonium-N can lower fertilizer costs and reduce odors and the likelihood of nutrient loss in runoff, thus providing both economic savings to the farmer and environmental benefits to the society
Nitrogen in Manure
Management of manure N starts with knowing the N content of manure and the relative amounts of the two main forms, urea or ammonium-N and stable organic-N. The urea-N fraction is quickly converted in the soil to plant-available ammonium (NH4 +), and so it is essentially equivalent to fertilizer N. As manure left on the soil surface dries and the pH rises, NH4 + can rapidly convert to ammonia gas (NH3), which is readily lost to the atmosphere. If manure is mixed into the soil, ammonium- N is adsorbed onto the exchange complex of the soil and retained.
The N content of manure varies greatly from farm to farm depending on animal diet, amount of bedding added, water added from rain or milk house waste, etc. For example, a random set of 30 liquid dairy manure samples from Vermont farms showed greater than four-fold range of both ammonium and total N (Fig. 1). Typically, the ammonium fraction comprises about 50% of the total N. Despite the wide range of values the average approximates typical book values. Because of the great variability in manure nutrient content, the only way to know the N content of the manure on your farm is to sample it and have it analyzed (see On-Farm Quick Tests for Manure section). Then it can be used as the basis for determining the manure rate to meet the N crop need.
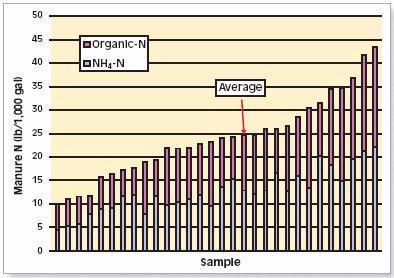
Figure 1. Nitrogen content (NH4-N and organic N) of 30 random dairy manure samples analyzed by the Agricultural and Environmental Testing Lab, University of Verm
Pattern and Amount of Ammonia Volatilization
Ammonia volatilization losses vary greatly depending on environmental conditions and management. They can range from over 90% of the applied ammonium- N for surface application with optimal conditions for volatilization, to only a few percent when manure is injected or incorporated immediately into the soil. Under typical conditions, losses from dairy manure left on the soil surface range from 30 to over 50%. The ammonia loss is usually greatest during the first few hours after application as shown in Fig. 2. This emphasizes the importance of rapid incorporation of manure to prevent this loss of N. In contrast, drier poultry litter has a slower initial rate of loss than slurries, but losses extend over several days or weeks.
Factors affecting ammonia volatilization include: a) manure characteristics such as dry matter content, pH, NH4-N content, b) application management (especially incorporation and timing), c) soil factors that affect infiltration of manure into the soil (soil moisture, soil properties, plant/residue cover), and d) environmental factors such as temperature, wind speed, rainfall (3). Of these factors, application management offers the greatest potential for reducing NH3 loss and improving N utilization by the crop. Management practices designed to reduce ammonia loss from manure provide other benefits as well — reducing phosphorus runoff losses and controlling odor, which may be as important to many livestock producers as the N savings.
Manure Incorporation by Tillage
The rapid loss of ammonia from dairy slurries (Fig. 2) exemplifies the need for timely incorporation. Even a one-day delay in incorporating manure slurries can lead to loss of 50 to 90% of the ammonium-N. While all tillage methods will help to control ammonia losses from manure if done immediately after application, the more thorough and deep the incorporation, the less ammonia is lost, e.g., tilling with a mouldboard plough is more effective than with fixed tines. Research with dairy slurry in Maryland showed reductions in
NH3 loss of 90 to 98% from immediate tillage with chisel, disk (Fig. 3) or mouldboard plough (Fig. 4). In a Canadian study, disking cattle manure reduced ammonia losses by 85 to 90% (5). Cultivating before slurry application also helps to reduce ammonia emissions by increasing the rate of infiltration into the soil.
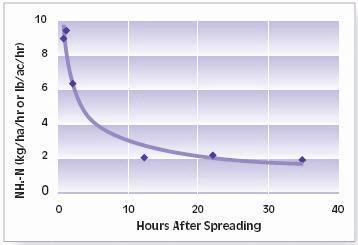
Figure 2. Rate of NH3 emission from dairy slurry surface-applied at 65,300 L/ha (17,000 gal/ac) in Williston, VT (2).
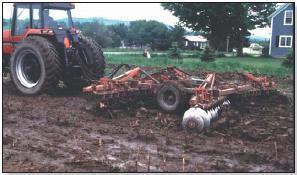
Figure 3. Incorporating liquid manure with a disk-harrow immediately after spreading.
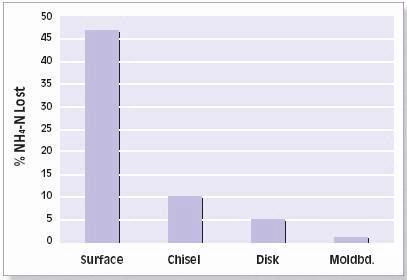
Figure 4. Ammonia loss from dairy slurry incorporated by different tillage methods. Beltsville, MD (4).
Injection and Other Direct Incorporation Methods
A range of equipment options are available for direct incorporation of liquid manure. Direct incorporation can be defined as methods which incorporate the manure directly into the soil without a separate tillage operation, most commonly with knives, chisels, or other tillage tools mounted in the front or rear of a tank spreader (6) (Fig. 5). Injection of manure below the soil surface is the most effective method for controlling ammonia volatilization since there is no exposure of manure to atmosphere (assuming no surfacing of slurry), but there are also other equipment systems for use in annual cropping systems. Deep injection with a knife or chisel (15–30 cm or 6–12 in) has produced large reductions in ammonia missions from slurries applied to corn in the US (7). The reduced ammonia volatilization is generally reflected in improved N utilization and increased yields. Improved N uptake and higher corn yields have been observed in Ontario from liquid cattle manure when it was injected at either pre-planting or at sidedress time compared to surface application (8). Increased corn yields from sidedress-injected dairy manure were reported also in New York (9). In recent years, a horizontal sweep injector (Fig. 6) that operates at a shallower depth (10–15 cm or 4–6 in; Fig. 5b) has become more popular because it provides more even distribution of manure, improves N availability, and requires less power (10). Increased N has been reflected in higher Pre-sidedress Nitrate Tests (PSNT) and higher corn grain yields (see Spring N Tests section).
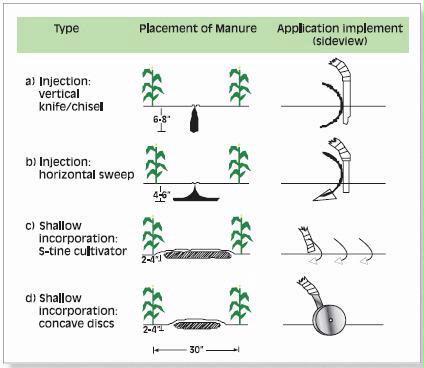
Figure 5. Equipment options for direct incorporation of liquid manure in row crops or on bare ground (6).
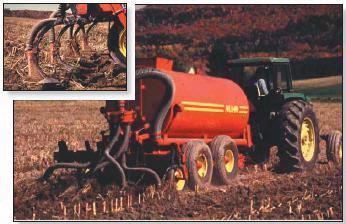
Figure 6. Sweep injection incorporates manure 10 to 15 cm (4 to 6 in) below the soil surface.
A relatively new design, now available commercially from a few companies in Canada and the U.S., does not actually inject the manure but mixes and covers it with soil using either “s-tine” cultivator shanks or pairs of concave covering disks. (Figs. 5c, 5d, 7, 8, 9). Another implement recently marketed in North America bands the liquid manure over openings created with aeration tines (see Low Disturbance Manure Application section). These methods require less power than injection tools and can be operated at a faster ground speed and with fewer problems on stony soils.
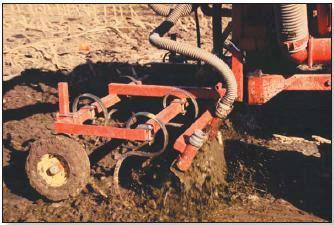
Figure 7. Direct incorporation of liquid manure with an s-tine cultivator mounted on the rear of the tank spreader.
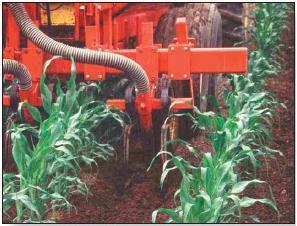
Figure 8. Sidedress of dairy slurry between corn rows with stine cultivators. ont. (For kg/1,000 L multiply lb/1,000 gal by 0.12).
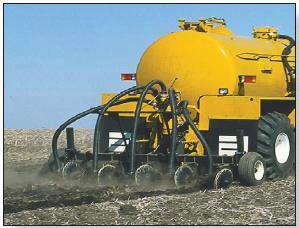
Figure 9. Shallow incorporation of liquid manure with paired-disk applicator (Livestock and Poultry Environmental Stewardship Curriculum; USDA/EPA).
In a two-year trial in Vermont we compared application of liquid dairy manure in the fall (surface-applied, sweep injection, or s-tine cultivation) and spring (s-tine cultivation). Nitrogen availability, as indicated by PSNT values (Fig. 8), was higher for the incorporated (sweep injection, and s-tine cultivation) than surface applied manure, and spring application provided more N than fall application. Manure left on the surface in the fall provided no additional available N. Corn silage yields followed similar trends as the PSNT.
Some farmers, especially in Canada, now incorporate liquid manure at sidedress time, when corn is 30– 60 cm (12–24 in) tall (Fig. 9) (see Injecting Liquid Swine Manure section). This method provides N close to the time of high N uptake by the corn, reducing the risk of early-season N loss, and it allows use of the PSNT to estimate need for N and therefore manure rate. A Quebec study showed better utilization from swine manure applied by “s-tine” incorporation than by deep injection (12). Dairy manure sidedressed with s-tine cultivation in Vermont was as effective for corn silage as fertilizer at equivalent rates of ammonium-N (13). Newer application implements (Fig. 10) are being developed to utilize liquid manure more effectively, conveniently and economically.
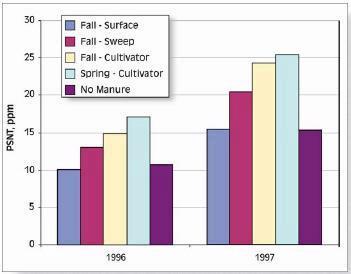
Figure 10. PSNT as affected by manure timing and tillage incorporation method in Sheldon, VT (11).
References
- Asman, W.A.H., M.A. Sutton and J.K. Schjorring 1998. Ammonia: emission, atmospheric transport and deposition. New Phytol. 139, 27- 48.
- Jokela, W.E. and J.J. Meisinger1999. Personal communication. University of Vermont and USDA-ARS.
- Meisinger, J.J. and W.E. Jokela 2000. Ammonia volatilization from dairy and poultry manure. pp. 334-354. IN Proc from Managing nutrients and pathogens from animal agriculture. Camp Hill, PA. 28-30, Mar., 2000. NRAES-130. Ithaca, NY.
- Thompson, R.B. and J.J. Meisinger 2002. Management factors affecting ammonia volatilization from land-applied cattle slurry in the Mid- Atlantic USA. J. Environ. Qual. 31, 1329-1338.
- Brunke, R., P. Alvo, P. Schuepp and R. Gordon 1988. Effect of meteorological parameters on ammonia loss from manure in the field. J. Environ. Qual. 17, 431-436.
- Jokela, W.E. and D. Côté 1994. Options for direction incorporation of liquid manure. pp. 201-215. IN Liquid manure application systems. Northeast Reg. Agr. Engin. Serv., Cornell Univ., Ithaca, NY.
- Hoff, J.D., D.W. Nelson and A.L. Sutton 1981. Ammonia volatilization from liquid swine manure applied to cropland. J. Environ. Qual. 10, 90-94.
- Beauchamp, E.G. 1983. Response of corn to nitrogen in preplant and sidedress applications of liquid cattle manure. Can. J. Soil Sci. 63, 377-386.
- Klausner, S.D. and R.W. Guest 1981. Influence of NH3 conservation from dairy manure on the yield of corn. Agron. J. 73, 720- 723.
- Schmitt, M.A., S.D. Evans and G.W. Randall 1995. Effect of liquid manure application methods on soil nitrogen and corn grain yields. J. Prod. Agric. 8, 186-189.
- Jokela, B., S. Bosworth and J. Tricou 1999. Manure Application Methods for Corn Field Studies on Direct Incorporation of Liquid Dairy Manure for Fall, Spring, and Sidedress Application in Corn LMWQ-4. Plant and Soil Sci. Dept., Univ. of Vermont, Burlington, VT. http://pss.uvm.edu/vtcrops/NutrientMgt.html #TOP.
- Côté, D., A. Michaud, T.S. Tran and C. Bernard 1999. Slurry sidedressing and topdressing can improve soil and water quality in the Lake Champlain Basin. Water Sci. and Applic. 1, 225-238.
- Jokela, W.E., S. Bosworth and D. Meals 1995. Water quality and yield effects of sidedressed dairy manure on corn: first year results. IN Animal Waste and the Land-Water Interface: Poster Proceed., Arkansas Water Resources Center, Fayetteville, AR.
Economic Advantage of Rapid Manure Incorporation: Vermont Experience
W.E. JOKELA
Plant and Soil Science Dept., University of Vermont, Burlington, Vermont
Can incorporation help match manure application rate to crop nutrient need? Let’s look at two scenarios for managing manure in corn (see below for soil, manure and crop specifics):
Case 1- spring-applied dairy manure injected or incorporated within one hour
Case 2- spring-applied dairy manure incorporated after seven days
Immediately incorporated manure would provide approximately 2 kg per 1,000 L (15 lb per 1,000 gal) of available mineral N (fertilizer equivalent) (1). Therefore, 64,000 L/ha (6,800 gal/ac) would be required to meet the crop need of 110 kg N/ha (100 lb N/ac). Because of the greater ammonia loss with delayed incorporation, the second scenario would require 108,000 L/ha (11,500 gal/ac) to meet the same N need. If there is additional land available, the difference in application rates (44,000 L/ha or 4,700 gal/acre) would have a potential nutrient value of about $72/ha ($29/ ac) (based on a cost of $0.55/kg or $0.25/lb for N and P2O5). Both management options supply excess phosphorus, but only 31 kg/ha (28 lb/ac) in Case 1 compared to 83 kg/ ha (75 lb/ac) in Case 2.
While manure has historically been applied to meet the crop need for N, concerns about runoff of phosphorus from fields into streams has led to a need to apply manure on a P basis on some fields. How would the two scenarios compare in this regard? In both situations the manure rate required to meet the P recommendation would be the same — 37,000 L/ha (4,000 gal/ac) (assuming 100% fertilizer equivalent for manure P). In Case 1 (quick incorporation) 45 kg/ha (41 lb/ac) of additional fertilizer N would be needed. In Case 2, with delayed incorporation, 71 kg N/ha (65 lb N/ac) would be required. The difference in cost would be about $14.80/ha ($6/ac), based on a price of $0.55/kg N ($0.25/lb N).
Soil, manure and crop specifics
- Nutrient recommendation for silage corn on well- to moderately well-drained soil (after accounting for starter fertilizer, previous crop and past manure B): 110 kg N/ha (100 lb N/ac) and 44 kg P2O5/ha (40 lb P2O5/ac).
- Dairy manure analysis: 2.8, 1.4, and 1.3 kg/1,000 L (23, 11 and 10 lb/1000 gal) as total N, ammonium- N and P2O5, respectively, and 8% dry matter. • Fertilizer prices: $0.55/kg ($0.25/lb) for N and $0.55/kg ($0.25/lb) for P2O5.
Reference
1. Jokela, W.E., F. Magdoff, R. Bartlett, S. Bosworth and D. Ross 2004. Nutrient recommendations for field crops in Vermont. Univ. Vermont Ext. Pub., Br1390, Burlington, VT. [www.uvm/~uvmext/publications/ br1390]
S. BITTMAN, C.G. KOWALENKO, D.E. HUNT and F. BOUNAIX
Agriculture and Agri-Food Canada, Agassiz, British Columbia
Farmers require low disturbance methods for applying liquid manure that can both reduce emissions of ammonia and odour and reduce the risk of nutrient leaching. A new applicator called AERWAY™ SSD (Holland Equipment, Norwich, ON) is designed to apply slurry to reduced-till corn land with relatively little soil disturbance. The applicator bands slurry over vertical aeration slots that facilitate infiltration of the slurry and contact with the soil. Rapid infiltration of manure reduces odour, loss of ammonia and risk of surface runoff. The aeration slots (10 per sq m or 1 per sq ft) are formed with 20-cm (8 in) long ground-driven tines spaced 19-cm (7.5 in) apart (Fig. 1, left). The narrow spacing between bands means less manure per band and more contact of manure with soil. Less manure per band reduces risk of leaching while the near-ground emitter position minimizes contact with crop residues or canopies and reduces emission of ammonia and odour.
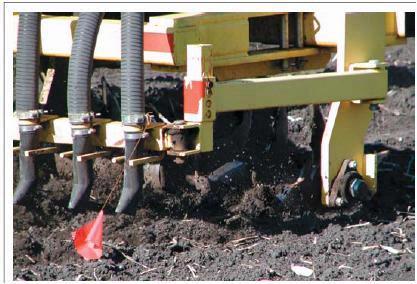
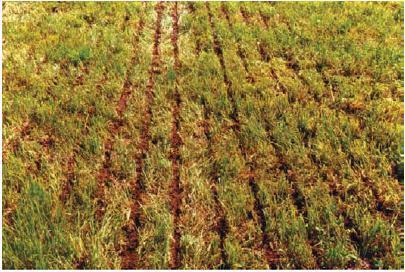
Figure 1. SSD manure applicator showing ground-driven tines and emission hoses (above). Low disturbance manure application on permanent grassland (below).
The size of slots are set by the depth and offset angle (0-10°) of the tines. Adjusting the offset settings affects both the degree of soil disturbance and the rate of infiltration. At limited angle, the implement can be used on winter cover crops as tests have shown that repeated use will not damage permanent grass (Fig. 1, right). At maximum angle (Fig. 2) a light tillage is accomplished but crop residue is left on the surface. Our research has shown that the SSD reduces ammonia loss from slurry applied to grass by about 50% and significantly reduced odour (1) compared to surface broadcasting. The applicator also reduces surface runoff and nutrient loss compared to surface applied manure.
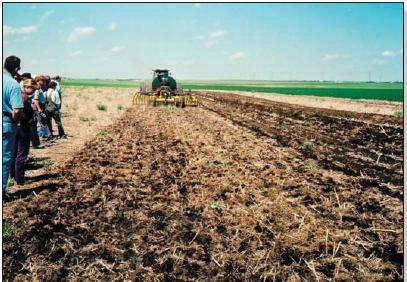
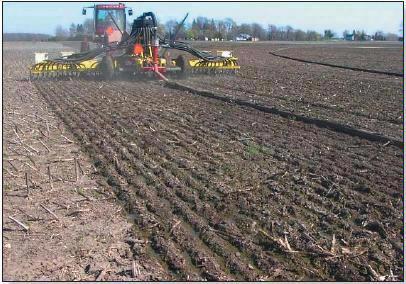
Figure 2. Application of liquid manure (approx. 60,000l/ha or 6,000gal/ ac) with Aerway SSD on conservation tillage silage corn (top) and barley (bottom). The unit on left is fed by a drag-hose while the unit on right is tank-pulled.
Reference
Lau, A., S. Bittman and G. Lemus 2003. Odor measurements for manure spreading using a subsurface deposition applicator. J. Env. Sci. Health. Part B 38, 233-240