Introduction
Livestock farms in coastal BC and the PNW are sinks for nutrients produced in other regions. Feed concentrates are railed in from the Prairies and the Midwest and alfalfa hay is trucked in from the interior of British Columbia, Alberta, Washington and Oregon. These imported feed stuffs bring mineral nutrients with them. Increasingly, dairy farms in the region have a surplus of nutrients coming onto the farm relative to products (milk, meat, forage) sold off the farm.
Nutrient management on livestock farms concerns control of (1) nutrient imports to the farm, (2) exports off the farm and (3) nutrient flows within the farm. Although forage systems are generally more sustainable and environmentally friendly than annual cropping, they can also be “leaky” when large quantities of nutrients and livestock wastes are handled. On dairy farms, typically only 20-33% of imported nutrients are exported as farm products while most of the remainder is lost to the environment.
Concern over leakage of surplus nutrients from livestock operations is world-wide. For example, in The Netherlands, allowable nutrient surpluses (inputs minus exports) are regulated on all livestock farms (Table 1). Note that there is a planned reduction in allowable surpluses until the year 2008.
| Table 1. The changing levels of allowable nutrient surpluses on livestock farms in The Netherlands | |||||
| . |
Year |
||||
| . |
1998 |
2000 |
2002 |
2005 |
2008 |
|
kg/ha (lb/ac) |
|||||
|
Nitrogen |
300 (270) |
275 (250) |
250 (220) |
200 (180) |
180 (160) |
|
Phosphorus |
17 (15) |
15 (13) |
13 (12) |
11 (10) |
9 (8) |
1. Impact of Livestock Density on Nutrient Management
The challenge of managing nutrients increases when density of livestock per land area is increased. To facilitate comparisons, animal populations are described in terms of animal units. One animal unit (AU) is equal to a 450 kg (1000 lb) ruminant. Livestock density is defined as the number of AU’s per unit of land area.
2. Impact of Housing and Storage Systems on Nutrient Management
The design and layout of a farm determines how manure nutrients are collected, stored and applied to the land.
On dairy farms, 25-70% of farm nitrogen is lost to the atmosphere during handling and storage of manure. Highest losses occur from lagoon/flush systems while lowest losses occur from slatted floor/covered pit storage. Covering manure storage and frequent barn cleaning help to conserve nitrogen. Barns with recycling flush systems are prone to elevated nitrogen losses even though they are typically cleaned 4-6 times per day. This is because the fluid is repeatedly aerated as the barn is flushed and because the storage facilities are usually very large and open.
Table 2 shows typical concentrations of nitrogen and dry matter in manure from typical housing and storage systems found on west-coast dairy farms.
Note that low nitrogen concentration in manure does not necessarily indicate that nitrogen has been lost. Rather, nitrogen concentration is correlated with dry matter content of the manure. Nitrogen concentration after storage is affected more by dilution of manure with rainwater and wash-water than by nitrogen loss during handling and storage (Table 2).
| Table 2. Nitrogen concentration of dairy manure from different types of housing and storage (sources: Tunney and Sullifan, 1997 Oregon State University; Schmidt, 1997 Dairy Producers’ Conservation Group). | ||||
|
System Description |
Dry Matter |
Total N |
Ammonium N |
Ammonium N |
|
1. Slatted floor or barns scraped twice daily; roofed storage; minimal dilution |
10% |
3.0-4.5 |
1.5-2.2 |
50% |
|
2. Barns scraped twice daily; uncovered above ground storage; minimal dilution |
8% |
2.2-4.0 |
1.1-2.0 |
50% |
|
3. Barns scraped daily; uncovered concrete pit storage |
6% |
1.7-3.5 |
0.9-1.7 |
50% |
|
4. Barns scraped daily; single cell lagoon storage |
4% |
1.2-3.0 |
0.6-1.5 |
50% |
|
5. Flush barn; solid/liquid separation; 2 or 3 cell lagoon storage |
<2% |
0.5-1.2 |
0.4-1.0 |
60-80% |
The type of housing and storage system also influences how the manure is applied to the land. On many low- and medium-density dairy farms, manure is mechanically scraped from the barns to the storage facility. Some of these barns have slatted floors with manure storage directly underneath. The manure on these farms averages 6-10% dry matter. These farms often use vacuum tanks (honey wagons) for land application, unless a custom slurry irrigation service is readily available.
The trend among high-intensity farms has been towards flush systems for barn cleaning and large earthen or concrete-lined lagoons for storage. Typically, these farms use solid/liquid separators to facilitate the flushing system. The liquid fraction of the stored manure often has less than 4% dry matter and sometimes even less than 2%. Because of the high volume of liquid handled, high-density farms tend to use irrigation systems to apply manure.
3. Impact of Feeding System on Nutrient Management
Within the limits of her genetic potential, a cow’s production is a function of the quality and quantity of her feed intake. New feed-balancing computer models, such as the Cornell Net Carbohydrate Protein System, have greatly improved ration formulation (see Ch. 7).
The forage component of a ration (grass or grass-legume and corn) ideally contains 43% neutral detergent fibre (NDF), 33% non-structural carbohydrates (NSC – 100% as starch), 13.5% crude protein (CP) and less than 11% ash. All carbohydrate components should be highly rumen degradable. The crude protein would be 60% soluble, and this soluble protein may contain up to 65% non-protein nitrogen.
The balance of the diet comprises concentrate containing entirely degradable non-structural carbohydrates along with the appropriate proportion of rumen degradable and rumen by-pass protein. Rumeninert fat would also be supplemented.
| Table 3 – How Management Affects Nitrogen Efficiency On Dairy Farms (Case Studies of Three Dairy Farms In The UK) |
||||||
| Farm 1 | Farm 2 | Farm 3 | ||||
| Inputs: | kg nitrogen/ha (lb nitrogen / ac) | |||||
| Fertilizer | 319 (287) | 190 (171) | 142 (128) | |||
| Feed | 120 (108) | 115 (104) | 89 (80) | |||
| Atmosphere | 30 (27) | 30 (27) | 30 (27) | |||
| Total | 469 (422) | 335 (302) | 261 (235) | |||
| Outputs | ||||||
| Milk | 66 (59) | 64 (58) | 55 (50) | |||
| Animal | 6 (5) | 7 (6) | 5 (5) | |||
| Total | 72 (64) | 71 (64) | 60 (55) | |||
| Surplus | 397 (358) | 264 (238) | 201 (180) | |||
| Leached N | 61 (55) | 30 (27) | 28 (25) | |||
| Nitrogen Efficiency OF Whole Farm (%) | ||||||
| Farm product / All inputs | 15 | 21 | 23 | |||
| Farm product / Purchased inputs | 16 | 23 | 26 | |||
| Farm product / Surplus | 18 | 27 | 30 | |||
|
||||||
| (adapted from S. Peel, A.G. Chalmers, and S.J. Lane | ||||||
How does the diet affect the efficiency of nitrogen use? Milk nitrogen efficiency is defined as milk nitrogen output divided by off-farm inputs of feed, fertilizer and atmospheric nitrogen. Improving the diet to increase annual milk production from 8200 to 10,000 kg (18,000 to 22,000 lb) increases milk nitrogen efficiency only from 32 to 35%. Deviating from the ideal ration increases urinary or faecal nitrogen. For example, if the crude protein in the forage component is increased from 13.5 to 18.5% without adjusting the supplement, and all the additional protein is rumen degradable, excretion of nitrogen in the urine will double.
Does improved feeding efficiency mean that the farm is more sustainable? Yes, if the feed is mostly home-grown and closely matches the nutritional need of the cows. But if more feed must be brought in to feed the cows more efficiently, the net impact is greater nutrient loading of the available land base.
In intensive grazing systems that rely on home-grown grass herbage for a very high proportion of the diet, nitrogen efficiency of the cows may be comparatively low. Rapidly growing grasses are highly digestible and contain up to 20-25% crude protein. These diets are high in rumen degradable protein and low in energy. Hence, proportionately more nitrogen is lost as urine or faeces and nitrogen efficiency of the cow is low. However, because nitrogen imports to these farms are often low, the overall effect from a nitrogen budgeting perspective is generally favourable. (In good grazing systems, relatively more nitrogen is lost to the atmosphere than surface or ground water.)
The challenge for researchers today is to help producers grow as much of their feed requirements as possible and to match the nutritional quality of home-grown feeds to nutritional needs of cows. Reducing imported feeds means reducing excess nutrients!
| Table 4 – How Management Affects Nitrogen Efficiency On Dairy Farms (Case Studes of Three Dairy Farms In Washington State) |
|||
| Farm 1 | Farm 2 | Farm 3 | |
| Inputs: | kg nitrogen/ha (lb nitrogen / ac) | ||
| Fertilizer | 3 (3) | 100 (90) | 111 (100) |
| Feed | 800 (720) | 659 (593) | 87 (78) |
| Atmosphere | 30 (27) | 30 (27) | 30 (27) |
| Total | 833 (750) | 789 (710) | 228 (205) |
| Outputs | |||
| Milk | 228 (205) | 240 (216) | 64 (58) |
| Animal | 2 (2) | -10 (-9) | 0 (0) |
| Total | 230 (207) | 282 (254) | 64 (58) |
| Surplus | 603 (543) | 507 (456) | 164 (148) |
| Nitrogen Efficiency OF Whole Farm (%) | |||
| Farm product / All inputs | 28 | 36 | 40 |
| Farm product / Purchased inputs | 29 | 37 | 32 |
| Farm product / Surplus | 38 | 56 | 39 |
| Farm Profile | |||
| Herd Size | 418 | 994 | 40 |
| Corn – hectares (acres) | 36 (89) | 77 (190) | 0 (0) |
| Grass – hectares (acres) | 46 (114) | 154 (380) | 22 (54) |
| (adapted from C.G. Cooger, T.N. Cramer, A.I. Bary, and D.C. Grusenmeyer. WSU, Puyallup, WA (unpublished data). | |||
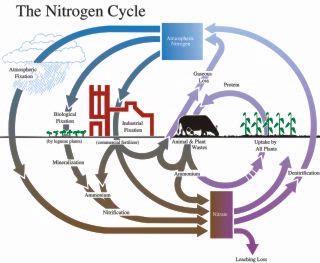
Fig 1. Nitrogen cycle.
Adapted from D.M. Ball, C.S. Hoveland and G.D. Lacefield. 1991. Southern Forages. Potash and Phosphate Institute and Foundation for Agronomic Research, Norcross, GA. 256pp.
Inputs
Plants obtain most of their nutrients from the pool of dissolved nutrients in the soil. This solution is constantly being replenished from three sources: inputs (manure, fertilizer, and other amendments), decomposing organic matter, and release of nutrients held weakly by the soil particles (mainly nutrients with a positive charge such as calcium, potassium, magnesium and ammonium). Small amounts of nutrients may be deposited in rainwater (ammonium, sulphate) or applied in irrigation water (nitrate).
Note that the negatively charged nutrients (nitrate, phosphate, and sulphate) are generally not held by soil particles so they do not take part in the exchange with the soil.
| kg/ha (lb/ac) | |||
| Location | Nitrogen | Phosphorus | Potassium |
| British Columbia | 180-620(160-550) | 40-170(35-150) | 95-155(85-140) |
| Washington | 195-820(180-740) | 70-185(60-170) | 64-410(60-370) |
| Table 5. Annual nutrient inputs on dairy farms in western BC and Washington. | |||
The ranges for nutrient inputs to British Columbia and Washington dairy farms are listed in Table 5. Note the very wide range of inputs among farms. By comparison, annual nutrient inputs on UK dairy farms average 380 kg/ha (339 lb/ac) of nitrogen, 36 (32) of phosphorus and 266 (221) of potassium. Much lower inputs are supplied in the pastoral systems of New Zealand.
Plant Uptake
Forage crops harvested in south-coastal BC typically contain 2-4% N, 0.2-0.4% P, 2.0-4.0% K and 0.3-0.4% S. Average values for these nutrients in samples submitted to the South coastal Forage Competition from the 1993-97 crop years are shown in Table 6.
Assuming annual yields of 13 t/ha (6.0 ton/ac), the amount of nutrient removed from the soil in a single year is: 360 kg/ha (325 lb/ac) of nitrogen, 45 (40) of phosphorus, 400 (360) of potassium, 30 (27) of magnesium and 35 (32) of sulphur. The pattern of nutrient uptake and growth depends on weather patterns and harvest management. Note that 40% of the total plant nitrogen and a similar proportion of other nutrients remain in the unharvested portion of the plant (stem bases below cutting height, crowns and roots).
| Carbon to Nitrogen (C:N) Ratio
In soils, mineralization and immobilization of nitrogen happen simultaneously. The balance between these processes is influenced by the C:N ratio of the organic materials in the soil. Organic material with a high C:N ration (e.g. straw, sawdust, etc.) promotes microbial growth which consumes mineral nitrogen in the soil. These types of materials create a shortage of nitrogen for the crop. If the amount of mineral N exceeds that which is necessary for microbial growth, surplus N will be released.
C:N ratios of common organic materials |
Up to 50% of the herbage may become senescent before harvesting. The dying leaves at the base of grass plants release some of their nutrients which are stored in the crowns. The dead leaves are left with a high carbon to nitrogen (C:N) ratio so that they are slow to decompose and form a part of the thatch, characteristic of old grass stands.
Animal Intake and Excretion
Ruminants retain only about 25% of consumed nitrogen, 35% of phosphorus and 12% of potassium. The remainder of the consumed nutrients is excreted. With ideal protein content (see Ch. 7), cows excrete more than twice as much nitrogen in faeces as in urine. However, with increasing protein or increasing rumen degradability of protein, the amount and percentage of nitrogen excreted as urine rises. Under local conditions, about equal amounts of nitrogen are excreted in faeces as in urine.
In contrast, phosphorus is excreted primarily in faeces whereas potassium is excreted mostly in urine. Large variations in composition of stored manure, inability to regulate the individual nutrients, and problems in methods of application complicate the use of manure as the primary nutrient source in grass production.
| Table 6. Average nutrient composition of grass hay and silage entries in ‘South Coastal British Columbia Forage Competition’ (1993-1997) | |||
| Nutrient | GrassHay % | GrassSilage % | Nutrient Removal By Crop |
| Nitrogen | 2.8 | 2.8 | 360 (325) |
| Phosphorus | 0.33 | 0.37 | 45 (40) |
| Potassium | 3.1 | 3.1 | 400 (360) |
| Magnesium | 0.23 | 0.24 | 30 (27) |
| Calcium | 0.47 | 0.56 | 65 (60) |
| In kg/ha or (lb/ac) based on a crop yield of 13 t/ha (6.0 T/ac) dry matter basis. | |||
Mineralization of Nutrients
Mineralization refers to the process of microbial decomposition of organic material that releases mineral nutrients into the soil. Plants take up nutrients only in the mineral form. For example, microbes break down proteins and other forms of organic nitrogen into the mineral form, ammonium. Other microbes further convert ammonium into nitrate (see Fig. 1
The mineralization rate is dependent largely on the carbon to nitrogen (C:N) ratio in the soil organic matter. In agricultural soils, the C:N ratio in the organic matter ranges from 10:1 to 15:1. The majority of the soil organic matter is very stable so the organic matter content of the soil does not change much from year to year. Similarly, organic amendments that contain at least 25 times more carbon than nitrogen do not easily break down. The stable organic matter becomes the humus fraction of the soil and improves the physical properties and cation exchange of the soil. Organic matter is more stable and tends to accumulate more in clay than in sandy soil. The reason is that clay soil is less aerated and has more surface area to adsorb organic colloids.
Only the much smaller ‘degradable’ pool easily mineralizes and provides fresh nutrients. Rate of mineralization is strongly enhanced by a history of manure and fertilizer application. Mineralization is more active in well drained than poorly drained soils, especially when they are warm. For unknown reasons, freshly generated populations of microorganisms (e.g. after drought or freezing events) mineralize organic matter more aggressively than stable older populations. Many species of protozoa, fungi, nematodes, and earthworms are active in mineralization (see “Notes from the Underground”).
Soils on most dairy farms in the coastal region have long histories of manure application. Recent research out of Washington State indicates that mineralization rates on fields with a history of manure application can be nearly double those of non-manured fields. Over the growing season, the impact of this may be a release of up to 220 kg N/ha (200 lb/ac). This must be accounted for in nutrient management plans. Values up to 400 kg/ha (360 lb/ac) of mineralized nitrogen have been reported from a single year in the UK. (In the UK 20-40% of all mineralization occurred in November to February.)
It is clearly important to predict mineralization rates to determine fertilizer requirements. Unfortunately, no such commercial test is yet available anywhere in the world. The best approach for producers is to assess their fields with test strips.
* Note: mineralization of sulphur follows that of nitrogen, but phosphorus processes are more complex.
Evidence that applied nitrogen is immobilized (tied up) and re-released in BC forage soils
| Did You Know |
| Rain containing ammonia (referred to as acid rain) is actually alkaline, not acidic. But when this rain falls on the soil, the ammonia is oxidized causing the soil to acidify. Thus ‘acid rain’ should be renamed ‘acidifying rain’. (Courtesy of D. Sullivan, OSU) |
Both forms of inorganic nitrogen (nitrate and ammonium) can be either absorbed by grass or assimilated into new microbes. Mineral nitrogen captured by microbes is said to be immobilized. When nitrogen is applied to grass there is fierce competition between crop and microbes and the crop does not totally win.
This phenomenon was observed by researchers at PARC (Agassiz). In their study, 400 kg/ha (360 lb/ac) of nitrogen was applied as a single dose in March. The crop was harvested four times over the season, with the fourth harvest in October. Judging by yields in the final harvest, it appeared that much of the benefit of the March dose had disappeared.
But this was not the case! In two of three years that this trial was done, the March application of nitrogen left a profound effect on plant nitrate and crude protein content in the fourth harvest, about six months after the fertilizer was applied (Table 7). This delayed effect was surely due to the nitrogen being immobilized through the season by soil microorganisms. Such responses demonstrate that nitrogen transformations within agricultural soils are very dynamic.
Loss of Nutrients from Forage Fields
Environmental Consequences of Nutrient Losses
1. Nitrogen leached as nitrate may contaminate ground water.
2. Nitrogen runoff as ammonium or organic matter is detrimental to surface waters and very harmful to fish habitat.
3. Nitrogen is lost to the atmosphere as nitrogen gas (not harmful), as nitrous oxide (potent greenhouse gas), and as ammonia (forming acid rain and fine particulates that are harmful to lungs).
4. Phosphorus (and organic matter) which runs off into surface waters promotes the growth of algae which eventually deplete dissolved oxygen and cause the water to become murky so that fish are unable to thrive. Phosphorus may leach from soils containing very high levels. Leached phosphorus may eventually seep into surface waters.
5. Leached potassium and sulphur are thought to have little environmental impact at present.
Ammonia Loss by Volatilization
Ammonia volatilizes (evaporates) from livestock housing and waste storage facilities. Ammonia is also lost from application of manure, application of ammonia and urea fertilizers, and even directly from plants. From 30 – 80% of ammonium nitrogen in slurry may be lost during field application, with the greatest losses immediately after application. Efficient methods of manure application are discussed below.
| Table 7: Nitrate-nitrogen and crude protein in fourth harvest of orchardgrass (October) as affected by nitrogen applied in March for the first harvest of the same year. | ||||||
| Nitrogen Rate (kg N/ha) |
N itrate-N (ppm) | Crude Protein (%) | ||||
| 1989 | 1990 | 1991 | 1989 | 1990 | 1991 | |
| 0 | 82 | 95 | 25 | 19.9 | 14.9 | 14.3 |
| 400 | 69 | 1748 | 1116 | 16.3 | 16.7 | 16.9 |
Nitrate Loss by Denitrification
Whereas ammonia is volatile and readily evaporates, nitrate can be lost only through leaching (see below) and denitrification. Denitrification is a biological process carried out by anaerobic bacteria that substitute nitrate for oxygen in their metabolism when oxygen is not available. The nitrate is degraded into atmospheric nitrogen or nitrous oxide. Whereas atmospheric nitrogen is obviously not harmful, nitrous oxide is a potent ‘greenhouse gas,’ helping to trap heat in the atmosphere.
Annual losses by denitrification can be substantial, ranging from 15 – 110 kg nitrogen/ha (13-100 lb/ac). Daily nitrogen losses can be as high as 2 kg/ha (2 lb/ac). The process is most rapid in warm, saturated, anaerobic soils containing a lot of nitrate.
Nutrient Losses by Leaching and Runoff
Greatest risk of leaching occurs during the high rainfall period lasting from October to March. The risk of leaching from forage fields is much smaller than from annual crops because of the well-developed root system and microbial population. In fact, forage systems were once considered impervious to leaching. However, new information from many countries has shown that substantial leaching may occur from heavily fertilized forage crops. History of manure and fertilizer management, age of sward, soil conditions, drainage and weather patterns affect the amount of leaching.
i. NITROGEN
There have been relatively few direct measurements of leaching from forage fields in south-coastal BC or the Pacific Northwest. Productive grass stands that receive less than 400 kg/ha (360 lb/ac) of nitrogen usually have little soil nitrate left in fall. However, environmental conditions favouring high rates of mineralization may result in unexpectedly high soil nitrate levels. Research in England has shown higher rates of nitrogen leaching from grasslands in the fall after a hot dry summer than after a cool wet one. Amounts of residual soil nitrate after fall application of manure in BC are shown below (See ‘Fall Manure Application,’ Pg. 42).
A new concern is the leaching of organic nitrogen. This form of nitrogen may eventually find its way to surface waters, contributing to eutrophication. More organic nitrogen is leached from grass-legume stands than from pure grass stands.
ii. PHOSPHORUS
In the past, leaching of phosphorus was thought to be negligible because of the immobility of phosphate in the soil. Now, seeping of leached phosphorus is considered a possible threat for surface waters.
Leaching of inorganic phosphorus is known to occur when the sorption capacity of the soil is saturated. Also, phosphorus in the organic form can leach from fields with a history of heavy manure or phosphorus fertilizer application. A recent study in Australia demonstrated that a third of applied phosphorus might leach through soils that have large numbers of macropores (cracks). In the Australia study, a single rainfall event leached as much as 0.5 kg/ha (0.4 lb/ac) of phosphorus.
Nevertheless, runoff of phosphorus remains the greater concern, with losses reaching 2 kg P/ha (1.8 lb/ac) in snow-melt and over 0.5 kg P/ha (0.4 lb P/ac) from spring rains.
iii. POTASSIUM
Recent information from farm potassium budgets in Coastal BC and the PNW imply that leaching of potassium can occur on some farms. Leaching losses would be higher from sandy than from fine-textured soils. Runoff losses of potassium as high as 30 kg/ha (27 lb/ac) have been recorded after application of farmyard manure in October. Loss of potassium is not considered to be an environmental concern at present.
iv. SULFUR
Leaching of sulphate coincides with leaching of nitrate as both ions are negatively charged and mobile in the soil. Losses ranging from 11 – 29 kg S/ha (10-25 lb S/ac) have been measured in the UK and New Zealand. Leaching of sulphate is not a significant environmental concern at present.
How much nitrogen for optimum production?
Figure 3 shows the wide range possible for response of grass to fertilizer nitrogen. In all trials, 400 kg/ha (360 lb/ac) of nitrogen produced near maximum yields of approximately 16t/ha (7.1 ton/ac), but the trials differed widely in the yield benefit from fertilizer.
Fig 3. Range of yield responses by unirrigated forage grasses to application of nitrogen fertilizer in coastal BC (for lb/ac multiply kg/ha by 0.9 and for T/ac multiply t/ha by 0.45)
In 1991, fertilizer increased yield by 8 t/ha (3.6 ton/ac) of dry matter whereas in 1989 the increase was only 2 t/ha (0.9 ton/ac). In the 1989 trial most of the nitrogen required by the crop was released (mineralized) from the soil, whereas nitrogen released from the soil in the 1991 trial could support only half the potential grass yield. Mineralization of soil nitrogen is discussed above (see Nutrient Cycling).
Is there a test to predict how much nitrogen the soil will release over the growing season? For corn crops, the ‘pre-sidedress nitrogen test’ is used to indicate whether nitrogen fertilizer is likely to be required on a particular field. Unfortunately, grass systems are more dynamic and no such test has yet been found. At present, use of test strips with different application rates is the best approach. Pasture probes can be used to help estimate yield differences among the strips.
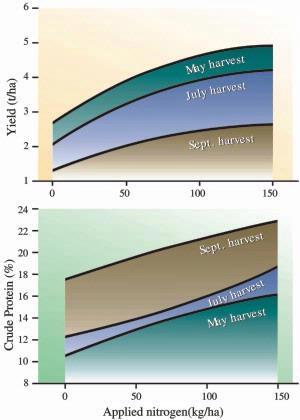
Fig 4. Seasonal effect of nitrogen fertilizer on grass (tall fescue) yields in coastal BC. Trials were conducted without irrigation in 1994-96 (for lb/ac multiply kg/ha by 0.9 and for T/ac multiply t/ha by 0.45).
When to Apply Nitrogen Fertilizer
Which harvest responds most to nitrogen?
Between a quarter and a third of annual production is harvested in the first cut. Lengthening days, ample moisture, stem elongation and use of root reserves contribute to the high spring production. The yields of our cool-season forages are lower in summer than in spring because of high temperatures, shortening days and water deficits. Fall production benefits from better temperatures and moisture but suffers from the short daylength.
A study at PARC (Agassiz) showed that grass both produces most herbage and needs most nitrogen in spring (Fig. 4; shows the yield for three of the five harvests taken). Both yield and nitrogen requirements were lower in summer and declined further in fall. In these trials, optimum nitrogen rates would be 75-125 kg/ha (70-110 lb/ac) in May, 50-100 kg/ha (45-90 lb/ac) in July and 25-75 kg/ha (25-70 lb/ac) in September.
What happens if you apply all the nitrogen in spring?
To answer this question, researchers at PARC (Agassiz) compared 400 kg nitrogen/ha (360 lb/ac) as a one-time spring application or as four equal applications of 100 kg/ha (90 lb/ac) over the growing season.
The results were surprising and instructive. The great differences in pattern of fertilizer application had only a small effect on total yield (Table 8) or average crude protein content of the crop. These results show the dynamic yet stable nature of forage production.
In contrast, fertilizer distributions do produce important differences in nitrate concentration in plant tissue. In the first crop taken after applying 400 kg N/ha (360 lb/ac), concentrations of nitrate-nitrogen averaged 3800 parts per million (ppm), more than three times the recommended maximum level. Concentrations of nitrate-nitrogen declined progressively in later harvests, falling to 1000 ppm by the fourth harvest. When nitrogen was applied in four equal doses of 100 kg/ha (90 lb/ac), nitrate-N concentration ranged from 1400-2200 ppm (see Figs. 23 and 24). (Note that nitrate content is reported either as nitrate or nitrate-N concentration. To convert nitrate to nitrate-N divide by 4.)
Table 8: Effect of distribution pattern for nitrogen fertilizer on total annual herbage yield.
| Fertilizer Applications * | Dry Matter YieldT/ha (ton/ac) | Relative to Equally Distributed N |
| 100-100-100-100 | 14.8 (6.7) | 100% |
| 400-0-0-0 | 14.1 (6.3) | 95% |
Grass response to delayed fertilizer application.
Farmers are often faced with delayed application of fertilizer after harvest. What the crude protein content of the grass. Therefore, the overall effect of delayed application on uptake of nitrogen was very small. Delaying fertilizer application increases the content of nitrate in the herbage.
‘T-Sum’ Method for Timing Spring Nitrogen
‘T-Sum’ is a method to determine when to make the first application of nitrogen fertilizer in spring. The ‘T-Sum’ value is the accumulated mean daily temperatures (in ° C) above zero, starting on January 1 (below-zero temperatures are ignored). For example, if the mean daily temperatures for a 5-day period were 6, 3, 0, 1, and -4°C, the ‘T-Sum’ total is 10. The ‘T-Sum’ concept assumes that rate of spring growth is related to accumulated mean temperature.
In the UK, the ‘T-Sum’ value of 200 is widely accepted for applying spring nitrogen and ‘T-Sum’ information is published weekly. In a study at PARC (Agassiz), fertilizing at ‘T-Sum’ 300 produced first-cut yields that were marginally higher than at ‘T-Sum’ 200, while uptake of nitrogen was about 10% higher (Table 9). The late-maturing variety did not benefit more from higher ‘T-Sum’ values. ‘T-Sum’ was not affected by source of nitrogen (ammonium nitrate vs. urea). An earlier study at Agassiz and on Vancouver Island showed a slight advantage for ‘T-Sum’ 200.
Table 9. The effect of applying nitrogen by ‘T-Sum’ value on yield and nitrogen uptake of early and late maturing grasses at PARC (Agassiz)*
| T-Sum | |||||
| 200 | 300 | 200 | 300 | ||
| Yield – t/ha (T/ac) – |
Nitrogen Uptake – kg/ha (lb/ac) – |
||||
| Early Maturing | |||||
| Orchardgrass | Benchmark’ | 3.5(1.6) | 3.5(1.6) | 3.5(1.6) | 3.5(1.6) |
| Tall fescue | Maximize’ | 3.2(1.4) | 3.3(1.5) | 51(46) | 46(40) |
| Late Maturing | |||||
| Orchardgrass | Mobite’ | 3.7(1.7) | 4.0(1.8) | 51(46) | 56(50) |
*This study was supported by Westco Fertilizers Ltd., Calgary, AB
Tips on First Cut Nitrogen Management
Consider that 25 to 40% of the annual grass yield is taken in the first cut. Clearly, spring forage management is critical to feed production on the farm.
-When harvested at the same growth stage, late-maturing varieties of orchardgrass (e.g. Mobite), perennial ryegrass (e.g. Melle) and tall fescue (e.g. Courtenay) have higher yield but lower protein content than early-maturing varieties. Therefore, late-maturing varieties should be given more nitrogen than early varieties to support the high level of growth and maintain protein levels. It is wise to harvest late varieties at a slightly earlier growth stage than early-maturing grasses (See Ch. 7).
- Urea and ammonium nitrate sources are generally of similar effectiveness (urea may actually be slightly better for late-maturing grasses.)
- In coastal BC, ‘T-Sum’ 300 is slightly better than ‘T-Sum’ 200 for applying nitrogen fertilizer (see ‘T-Sum’).
- Factors such as slope and aspect (i.e. south vs. north) and drainage (well-drained soils warm up faster in spring) can influence optimum timing for fertilization.
In intensive livestock enterprises, manure can often supply most of the nutrient requirements of forage crops grown on the farm. The key is identifying a management system that will make the most efficient use of the manure nutrients.
Historically, most of the manure on local dairy farms was applied to corn land before planting in spring and after harvest in fall. After-harvest application in fall is strongly discouraged. Applying rates exceeding corn demands in spring will cause unacceptable residual nitrogen levels in the soil after harvest. Logically, manure should be applied primarily on grassland. Grass crops have a high nutrient requirement, can receive manure throughout the season and have a well-developed root-soil system for capturing nutrients and preventing leaching.

Fig. 6. Fixed passive manure separation with two cells.
Unfortunately, it is difficult for farmers to use slurry as the primary nutrient source for grass production for the following reasons: nutrient concentration is unknown, uniform application with current equipment is difficult, risk of smothering and fouling of leaves is possible, and the efficacy is variable. In fact, up to 80% of the ammonium in manure may be lost during field application with vacuum tanks or irrigation reels. Amount of loss depends on weather conditions, ammonium concentration, dry matter content and application rates (Fig. 7)
Fig 7. Effect of slurry dry matter content on volatilization of ammonia (as percent of applied ammonia)
| Strategies to overcome the “thick manure” problem:
When upgrading manure storage, many farmers have built 2-cell storage. The first cell is used primarily for settling and the second for liquid storage. If the material entering the first cell is in the 8-10% dry matter range, the liquid entering the second cell will typically be around 4-6%. The manure in the second cell contains proportionately more of the ammonium-nitrogen and potassium but less of the organic nitrogen and phosphorus. Some farms have installed mechanical separators to remove the solids. Numerous options are available with a wide range of prices and solid removal efficiencies. The dry matter content of the liquid fraction is usually less than 4%, even if the starting material is quite thick. At least 60% of the nitrogen in the liquid fraction is in the ammonia form. Grass response to separated liquid is excellent (see Fig. 8). Some farms dilute slurry with water for irrigating on forage crops. Hauling diluted slurry seems impractical. Following manure application with irrigation helps reduce ammonia loss. ‘Whey’ is reputed to stimulate microbial activity and may reduce the amount of solids. In a local study, whey reduced the solids content of liquid manure in 2 of 3 experiments (Schmidt and Paul, 1997). Studies in Northern Ireland have shown that adding strong acids (nitric or sulphuric) to slurry greatly reduces ammonia loss but this practice is not economical. |
| Dairy Or Hog Manure – Which Is Better?
A study at PARC (Agassiz) compared the effectiveness of dairy and hog manure as a nitrogen source for grass (tall fescue). Hog manure typically contains a higher proportion of its nitrogen as inorganic ammonium compared to |
 dairy manure. In this study, both manure types were equally effective when applied at the same rate of inorganic nitrogen. The ammonium in hog manure, applied with the conventional splash-plate, was 5-10% less effective than inorganic fertilizer in terms of grass yield and crude protein content. Therefore, to achieve the same grass performance, slightly higher application rates should be used. Banding hog manure improves its efficacy and reduces odour (see below). Hog manure can be safely used as the primary nitrogen source for grasses like tall fescue provided that it is applied at agronomic rates. Phosphorus levels in the soil should be monitored.
1. Influence of Form and Dry Matter Content of Manure
To maximize use of nitrogen from manure, the primary goal is to reduce ammonia loss. To a degree, this can be accomplished by altering the form and dry matter content of the manure. Manure in the 8-10% dry matter range is like thick soup and has these undesirable properties:
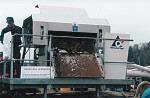
Fig. 9. Separating manure produces a solid fraction high in organic-N and phosphorus and a liquid portion high in ammonium-N and potassium.
i. Thick manure does not soak well into the soil unless rain or irrigation follows application.
ii. Thick slurry clings to grass leaves increasing exposed surface area and contributing to ammonia loss. Reducing dry matter of slurry reduces ammonia losses appreciably (Fig. 7)
iii. The adherence of manure to leaves can also ‘burn’ the grass, reducing the quality and palatability of the forage.
2. Influence of Method of Manure Application
A. Banding Systems for Slurry
Injection systems are used to reduce ammonia loss from slurry applied to cultivated land (Fig. 10). However, this technique cannot be easily used on grassland because of equipment costs, reduced rate of application, stones, and damage to stands. Nevertheless, interest in injection has been recently revived in some regions due to concern over nutrient runoff into streams.
Fig 8. Response of grass crops to forms of dairy manure at PARC, Agassiz (for lb/ac multiply kg/ha by 0.9 and for T/ac multiply t/ha by 0.45).
To overcome the difficulties of injection into grassland, a system was developed for applying manure in bands on the soil surface underneath the grass canopy. This ‘sub-canopy band application system’ (see Fig. 11) chops the slurry then delivers it via individual hoses to shoes which drag along the ground surface beneath the grass canopy. Locally, the applicator has been given the name ‘sleighfoot’ to reflect its appearance and motion. European studies have shown that slurry applied with sleighfoot applicators loses much less ammonium and gives off less odor than slurry applied with conventional spreaders.
A recent study at PARC (Agassiz) compared the response of grass to dairy slurry. The slurry was applied with either a splash plate or sleighfoot applicator and granular fertilizer. The tests were conducted in spring, summer and autumn. The rate of application was set to supply 50 and 100 kg/ha (45 and 90 lb/ac) of ammonium-nitrogen per cut.
|
A Farmers Observation At Woodwynn Farm, located on southern Vancouver Island, we use biosolids from the Capital Regional District to supply the nutrients for our market hay operation. Our interest in the sleighfoot came from the odour management standpoint. For two years we evaluated the prototype unit which was used in the trials at PARC (Agassiz). We found that the way in which the material was deposited at the base of the grass reduced odour substantially. The grass acted as a barrier to smell. We suspect that direct soil contact is helping to reduce loss of ammonia from the biosolids to the atmosphere In 1997, Woodwynn Farm purchased an 8000-liter (2000 US gal) tank with a 6-meter wide (20-foot) sleighfoot unit made in Holland by Buts Meulepas. We chose to surface-band rather than inject manure because the banding unit requires half the power of injection units to pull around the field. Also, banding does no root pruning unlike injectors. We also believe that placing manure on the soil surface where it is exposed to sun and air reduces pathogens. As this machine was extensively used we discovered other advantages of this application technology for our farm:
Contributed by Curtis Strong, P.Ag., Woodwynn Farm |
Table 10: Horizontal uniformity of spreading pattern for tank-based manure application systems.
| Manure Application System | Form of Manure | Variation (%) |
| Stationary splash plate | Liquid pig – 4.8% dry matter | 21 |
| Swiveling splash plate | Separated liquid pig – 3.8% dry matter | 18 |
| Lateral boom with equally spaced nozzles | Liquid pig – 3.6% dry matter | 31 |
| Trailing hoses linked to central distributor | Separated liquid pig – 3.8% dry matter | 14 |
In all three seasons, grass receiving banded manure yielded about as much as grass receiving purchased fertilizer -when compared at equivalent rates of mineral nitrogen. In contrast, response of grass to slurry applied with the splash plate was inconsistent, ranging from equivalent to much less (1.3 t/ha or 0.5 ton/ac) than fertilizer.
This study has a number of key implications for manure use in the future:
1. Banding of manure with the sleighfoot applicator is a consistent technique for supplying nitrogen to forage throughout the growing season. Appropriately applied manure can provide all the nutritional requirements of a productive grass stand.
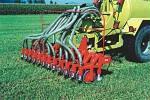
Fig.10. Shallow injection of manure into sod.
2. The sleighfoot spreads slurry evenly.
3. Banding with the sleighfoot widens the window of opportunity for application. Manure will not burn or contaminate grass even 10-14 days after harvest. In fact, ammonia loss is even lower when the grass is tall.
Fig.11. Banding of manure with the sleigh foot applicator is an effective method of applying slurry on grassland.
4. The sleighfoot reduces odour during land application of slurry (including swine).
Fig.12. Sleighfoot applicator leaves little manure on crop (left) compared to splash plate (right).
5. The fertilizer value of manure can be determined reliably using an inexpensive quick test (see section on manure analysis).
6. The overall benefits of the sleighfoot are reduced fertilizer expenses and less manure in the pit before winter.
B. Irrigation Systems for Slurry
With increasing farm size and increasing manure storage in recent years, there has been a growing interest in ‘trailing gun irrigation systems’ for application of manure. The primary advantage is that a large volume of manure can be applied in a relatively short period of time. Where custom services or rental services are available, many producers forego purchasing the systems in favour of hiring or renting.
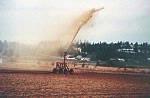
Fig.13. Trailing gun irrigation system applies large volume of manure quickly but neighbours may be offended.
Slurry irrigation is often criticized because of the high odour levels emitted. This situation is made worse when concentrated slurries (6-10% dry matter) are applied. However, with careful management, irrigation can be an effective method of applying very dilute or separated liquid manure. As long as the solids content is low (
Influence of Timing of Manure Application
The common practice on grassland is to apply manure as soon as possible after harvest in order to supply the regrowth with nutrients quickly and reduce damage to the new regrowth. Unfortunately, it is difficult for farmers to apply manure as quickly as purchased fertilizer. Also, when there is little plant cover ammonia losses due to volatilization can be substantial. The sleighfoot applicator makes it possible to delay manure application with minimum contamination of grass leaves.
WHAT HAPPENS TO PRODUCTION WHEN MANURE APPLICATION AFTER HARVEST IS DELAYED?
Delaying fertilizer application by about a week reduced yield slightly but did not affect nitrogen uptake so nitrogen content in the herbage increased slightly (see above: ‘When to Apply Nitrogen Fertilizer,’ Pg. 33). In contrast, there was little evidence that a week delay in banding of slurry lowered either yield or nitrogen uptake. Manure that is banded into a growing grass canopy is sheltered from wind, thereby less prone to volatilization of ammonia, and may promote direct absorption of ammonia by the growing leaves.
Note that this study showed that manure increases grass growth most in spring and least in the fall (see ‘Latest on Nitrogen Fertilization of Forages,’ Pg. 32).
Importance of Uniformity of Application
Uniform manure application is necessary for optimum production and conservation of nutrients. Table 10 shows the relative variability for various tank-based spreading systems. Of course, systems that spray manure into the air are affected by wind.
Among the spreading systems tested, the conventional splash plate had intermediate uniformity (21%). An applicator employing a swivelling splash plate was slightly better. The lateral boom with nozzles was especially variable. The most uniform of the systems tested pumps manure from a central distributor to individual trailing hoses. The sleighfoot applicator uses the same distribution principle and has similar uniformity.
Slurry irrigation is often criticized because of the high odour levels emitted. This situation is made worse when concentrated slurries (6-10% dry matter) are applied. However, with careful management, irrigation can be an effective method of applying very dilute or separated liquid manure. As long as the solids content is low (
Influence of Timing of Manure Application
The common practice on grassland is to apply manure as soon as possible after harvest in order to supply the regrowth with nutrients quickly and reduce damage to the new regrowth. Unfortunately, it is difficult for farmers to apply manure as quickly as purchased fertilizer. Also, when there is little plant cover ammonia losses due to volatilization can be substantial. The sleighfoot applicator makes it possible to delay manure application with minimum contamination of grass leaves.
WHAT HAPPENS TO PRODUCTION WHEN MANURE APPLICATION AFTER HARVEST IS DELAYED?
Delaying fertilizer application by about a week reduced yield slightly but did not affect nitrogen uptake so nitrogen content in the herbage increased slightly (see above: ‘When to Apply Nitrogen Fertilizer,’ Pg. 33). In contrast, there was little evidence that a week delay in banding of slurry lowered either yield or nitrogen uptake. Manure that is banded into a growing grass canopy is sheltered from wind, thereby less prone to volatilization of ammonia, and may promote direct absorption of ammonia by the growing leaves.
Note that this study showed that manure increases grass growth most in spring and least in the fall (see ‘Latest on Nitrogen Fertilization of Forages,’ Pg. 32).
Importance of Uniformity of Application
Uniform manure application is necessary for optimum production and conservation of nutrients. Table 10 shows the relative variability for various tank-based spreading systems. Of course, systems that spray manure into the air are affected by wind.
| Table 11: Effect of repeated manure application on the composition and yield of a tall fescue stand. | ||||
| Treatment | Ground Cover (%)* | Annual Yield | ||
| Grass | Soil | Clover | t/ha (Ton/ac) | |
| Control | 56 | 8 | 35 | 10.8 (4.8) |
| Fertilizer – low rate | 74 | 21 | 2 | 13.0 (5.8) |
| Fertilizer – high rate | 70 | 27 | 1 | 14.5 (6.5) |
| Manure – low rate | 75 | 26 | 0 | 13.9 (6.2) |
| Manure – high rate | 57 | 43 | 1 | 16.6 (7.4) |
| *Totals may not add to 100 because moss and weeds are not included. | ||||
Among the spreading systems tested, the conventional splash plate had intermediate uniformity (21%). An applicator employing a swivelling splash plate was slightly better. The lateral boom with nozzles was especially variable. The most uniform of the systems tested pumps manure from a central distributor to individual trailing hoses. The sleighfoot applicator uses the same distribution principle and has similar uniformity.
n contrast, variability of irrigation-based systems is usually higher, averaging 26-34% in one study and 15-22% in another. Irrigation systems are especially affected by wind conditions. Also, irrigation systems miss areas along field margins and headlands due to required setbacks and the circular distribution pattern. For these areas, farmers must use an alternative spreading method or inorganic fertilizer.
A new application method designed to improve on the uniformity of the “big gun” is called the trailing boom (Fig. 14). This system has downward directed nozzles and small splash plates equally spaced along the length of the boom. If the boom height and the pressure are set correctly, the system applies more uniformly and is less prone to drift than big irrigation guns.
Impact of Repeated Manure Applications on Grass- Positive or Negative?
We have seen that liquid manure can be used instead of fertilizer to fulfil the nitrogen requirements of grass, with little loss of yield or protein content. But what happens to the grass stand, the nutrient content of the soil and even the ecology of the soil (see “Notes from the underground,” Pg. 40) after repeated applications of dairy slurry?
A study was set up at PARC (Agassiz) to compare applications of equivalent rates of inorganic nitrogen as chemical fertilizer or manure. In this trial, manure was applied with a sleighfoot manure applicator, which conserves nitrogen. With manure in the 6-8% dry matter range, the application rate was equivalent to 56 – 68 m3/ha (6000 to 7500 U.S. gal/ac). The organic nitrogen fraction in the manure was extra.
YIELD AND STAND COMPOSITION:
In the third year of manure application, total yield was 9% higher and nitrogen uptake 5-9% higher from manured compared to fertilized treatments (see Table 11). In the fourth year, manured treatments yielded 10-21% more than fertilizer treatments. Higher yield and nitrogen uptake with manure than fertilizer is due partly to the use of an efficient application technique and partly to the release of additional nitrogen from the organic fraction of the manure. It also shows that there is no evidence that repeated manure applications reduce productivity of forage fields.
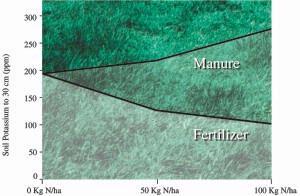
Fig 18. Effect of 3 years of manure or fertilizer nitrogen application to tall fescue stands on soil potassium levels (for lb/ac, multiply by 0.9).
At the high rate of manure application (100 kg/ha or 90 lb/ac of mineral nitrogen), the grass stand became considerably sparser than at lower rates of manure or equivalent rates of fertilizer (see Table 11). The manured stand was left with more open space between plants. However, the surviving plants were bigger so that the overall yield of the manured grass was greater than the denser fertilized stands. If the amount of open space were to increase further, it is likely that eventually weeds (especially fine-leaf grasses like Kentucky bluegrass) would invade the open spaces and yield would fall off (see Ch 4 and Ch 6).
At low rates of application (50 kg/ha or 45 lb/ac of mineral nitrogen), there was little difference in stand composition between fertilizer and manure. Note that white clover aggressively invaded stands that did not receive fertilizer or manure.
Thinning of stands on manured fields is often blamed in part on tire damage and soil compaction. In this study, neither was a factor; manure directly caused thinning of stands.
EFFECT ON SOIL POTASSIUM AND PHOSPHORUS:
Liquid dairy manure contains substantial quantities of potassium (K), especially if the cattle diet is rich in potassium. Three years of repeated manure applications increased soil potassium levels by about 35%. Manured plots had 3.5 times more soil potassium than fertilized plots (Fig. 18). Note that nitrogen fertilizer actually reduced soil potassium levels from the starting levels. This shows that mineral fertilizer can be used to lower soil potassium levels.
Available soil phosphorus was marginally higher in manured than fertilized treatments in the top 15 cm (6 in) of soil. No difference in phosphorus level was found between treatments in the 15 – 30 cm (6 – 12 in) soil horizon, indicating that phosphorus had not moved downward in the three years.
Impact of Applying Manure on Grass in the Fall
Throughout the region, on both sides of the border, regulations require that manure be applied on the land as a fertilizer source and not merely for the purpose of disposal. Thus, in the fall, manure must be spread on actively growing forages or on cover crops, not on bare corn fields. What happens to the nitrogen in manure spread on grass and cover crops in the fall?
Researchers at PARC (Agassiz) recently studied this question. They applied manure in mid-September or mid-October on grass and cover crops at rates of 100 or 200 kg/ha of total nitrogen (90 or 180 lb/ac). The cover crops fall rye and Italian ryegrass, were planted in mid-September.
Fig 19. ‘Apparent’ recovery of nitrogen from fall-applied manure in the roots and shoots of tall fescue and fall rye at PARC (Agassiz). (#For lb/ac multiply by 0.9).
By late November, the perennial rye-grass, tall fescue captured a total of 40 kg/ha (35 lb/ac) of the applied nitrogen, divided evenly in roots and shoots (Fig. 19). The fall rye cover crop captured only 10-15 kg/ha (9-14 lb/ac) of the manure nitrogen, most of it in the shoots.
Tall fescue reduced residual soil nitrate levels in late November by 20-30 kg N/ha (18-27 lb/ac) while fall rye reduced levels by about 10 kg/ha (9 lb/ac) (Fig. 20). Slightly less nitrogen was captured from manure applied in September than October but less nitrate was left in the soil from the September application.
Both crops were dormant and captured little nitrogen between November and March (Fig. 19), but from late March to early May tall fescue recovered 25-35 kg/ha (22-31 lb/ac) of the manure nitrogen compared to 5-10 kg/ha (4-9 lb/ac) for fall rye. Tall fescue continued to take up nitrogen in May and June, particularly from the October-applied manure.
Fig 20. Effect of crop type on ammount of nitrate-nitrogen remaining in the soil (120 cm or 48 in depth) in late November. Manure was applied in mid-September or mid-October at a rate of 200 kg/ha (180 lb/ac) total nitrogen. (*For lb/ac multiply by 0.9)
A total of 50-65kg/ha (45-60 lb/ac) of nitrogen from the fall-applied manure was recovered by tall fescue. This represents a respectable 25-35% of the total manure nitrogen applied in the fall. Surprisingly, 15 kg/ha (13 lb/ac) more nitrogen was recovered from the October application of manure than from the September application.
Fall applied manure improved spring yield of both perennial grasses (tall fescue and orchardgrass) by 1.5-2 t/ha (0.7-0.9 ton/ac) and cover crops (fall rye and Italian ryegrass) by more than 1 t/ha (0.4 ton/ac) (Fig. 21). Yields were slightly better with the October than September applications of manure.
This study shows that it is better to spread manure in the fall on perennial grasses than on fall cover crops and much better than on bare soil. Of the grasses, tall fescue is slightly better than orchardgrass because it is less dormant in the fall.
Fig 21. Yield increase in May crop resulting from application of dairy slurry in the previous fall. (*For Ton/ac multiply by 0.45)
The benefits of applying manure in fall must be balanced with the associated risks. As the rainy season approaches, the risk of nitrate leaching and surface runoff increases. To minimize risks, manure should not be spread within 10 m (30 ft) of ditches and streams. The Manure Management Guidelines for coastal BC suggest that application rates should not exceed 25% of the annual crop nutrient requirement. Hence, even for perennial grasses, fall manure application should never exceed 120 kg/ha (110 lb/ac) of total N.
Another factor worthy of consideration is the increased risk of disease and winter-kill associated with late fall application of nitrogen. Numerous studies have shown increased susceptibility of grasses to death over winter, or to attack by pathogens, with increasing rates of nitrogen. Ryegrasses are more susceptible to low temperatures than orchardgrass or tall fescue (See Ch. 6).
Phosphorus and Potassium in Manure
Phosphorus in manure is mainly in the organic form and is thus only slowly available to crops. However, organic phosphorus remains available longer because it is less subject to chemical fixation in the soil than soluble fertilizer phosphorus. The net result is that manure applied over many years builds up and maintains available soil phosphorus. Phosphorus is not very mobile in the soil and accumulates over time. Fields with a history of regular manure application usually have adequate phosphorus levels for grass production and do not require additional phosphorus fertilizer.
Phosphorus can be lost to the environment primarily by runoff of organic material or erosion of soil. The key to managing phosphorus for environmental protection is the establishment of good soil conservation practices that reduce runoff and erosion, and to minimize importation of phophorus to the farm.
|
Soil Nitrate Tests In Grass Fields – What Do They Tell You? In recent years, farmers have been encouraged to test nitrate levels in their fields, especially in fall, to obtain a report card on their nitrogen use. High nitrate levels indicate poor nutrient management and warn of potentially high leaching losses over winter. There is much less risk of high soil nitrate levels in grassland soil than in soil of corn or other annual crops because grasses have a large appetite for nitrogen. A recent trial by Washington State University at Puyallup, WA evaluated different rates and timing of dairy manure application on levels of residual soil nitrate in the fall. In this study, only plots receiving 800 kg of total nitrogen per ha (700 lb/ac) as manure in mid-summer ended up with high levels of soil nitrate in fall (Sullivan, 1997 – unpublished). At Agassiz, applications of 100 kg nitrogen per ha (90 lb/ac) in mid-August resulted in less than 30-35 kg/ha (30 lb/ac) of nitrate-nitrogen in the top 30 cm (12 in) of soil in the fall. These results show that testing soil nitrate levels in the fall can identify forage fields that have been greatly over-supplied with nitrogen. |
Because of the importation of large quantities of feed and fertilizer, soil potassium levels have been rising on many dairy farms over the past 15-20 years. Forage grass can take up large amounts of potassium, so elevated soil potassium levels are causing high concentrations in local forage (see Table 6). Excess dietary potassium can cause health problems in cattle (see Pg. 50) but eventually the potassium is excreted in urine.
The potassium in the urine fraction is very soluble. In the soil, it attaches loosely to clay particles and is readily available to plants. Potassium is more mobile in the soil than phosphorus but is less mobile than nitrate. Although some potassium may be leached through soil, especially sandy soil, this is not considered a pollution problem at present.
Rise in levels of soil phosphorus and potassium is a concern on many farms with high livestock densities. Low-density farms may also have problems if more fertilizer is purchased than is required or if excess manure is applied on certain fields. To monitor phosphorus and potassium levels, soil samples should be taken from every field at least every second year. If phosphorus and potassium levels increase without addition of commercial fertilizer, the farm has a manure surplus. In this case, the producer should look for more land or investigate off-farm marketing alternatives for the surplus manure.
1. Invertebrates beneath the canopy
All sorts of invertebrates make their home in the soil: springtails, mites, fly larvae, beetle larvae, millipedes, centipedes, earthworms and many others. Some of these organisms number millions per acre and constitute a considerable biomass. The total weight of earthworms may equal the weight of livestock that can be supported on the land. Some of the organisms, like wireworms and leatherjackets, feed directly on living plant material, but most consume dead organic matter or other soil invertebrates. The soil fauna is important in cycling energy, nitrogen and other nutrients among the various components in the system, including the microorganisms and forage crops.
Manure increases invertebrate populations in forage fields. A trial at PARC (Agassiz) showed that repeated applications of manure increased populations of voracious soil-dwelling insects called ‘carabid ground beetles’ (Fig. 15 and 16).
Fig 16. Carabid beetle populations in soil planted to tall fescue are affected by repeated manure and fertilizer application at PARC (Agassiz), BC
Several species of carabid were found. Fig. 15 shows the relative size of some of the beetles, from 0.3-2.5 cm (0.1-1 in). They are generalist predators that will feed on anything they can handle! Some examples:
- Bembidion species – insect eggs;
- Calathus fuscipes -caterpillars, aphids, weevils;
- Pterostichus melanarius – caterpillars, aphids, weevils;
- Carabus species – insects and earthworms;
- Carabus granulatus – insects, earthworms and slugs.
- P. melanarius appears to be the dominant species in the Agassiz trial.
This beetle can eat more than three times its own weight per day. No correlation has yet been made between available food and the carabid populations. In principle, increased carabid populations should reduce the numbers of important pests of forage crops, such as wireworms and leatherjackets, but the overall effect has yet to be determined.
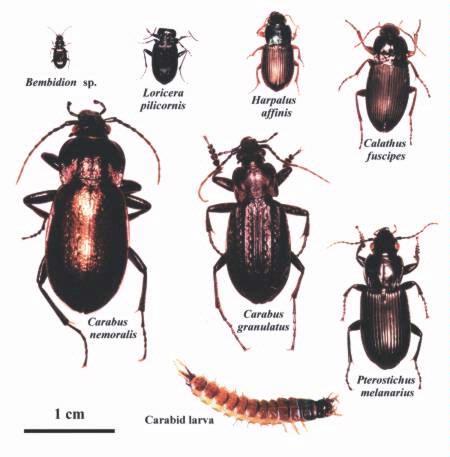
Fig 15. Carabid beetles found in a forage-manure trial at Agassiz, BC. (Photo by J. Troubridge and M.Knott, AAFC).
2. Microscopic creatures of the underworld
Manure contains various ‘foodstuffs’ (carbohydrates, fatty acids, amino acids, peptides) that provide energy for growth of bacteria and fungi. Therefore, the addition of manure to soil promotes growth of soil microorganisms.
The growing microbes have a great appetite for available nitrogen, from the manure or soil, which they consume and incorporate into their bodies. This nitrogen is ‘immobilized’ as it is made unavailable for plants or other microbes. The speed of immobilization by microbes is affected by the makeup of the biological community and the conditions in the soil.
Addition of nitrogen fertilizer to nitrogen-deficient soils promotes microbial growth, which temporarily immobilizes some of the fertilizer. Adding manure or other soil additives with high carbon:nitrogen ratios helps to immobilize the nitrogen in the soil.
Two kinds of microscopic animals (microfauna) in the soil graze on the bacteria and fungi that immobilize nitrogen. These are single-cell ‘protozoa’ and miniature roundworms called ‘nematodes’. Although these animals make up less than 10% of the living microorganisms in the soil, they control the populations of bacteria and fungi.
As they feed on microbes and grow, the ‘micro-animals’ excrete ammonium back into the soil. They also stimulate turnover of the remaining microbial biomass and promote activity of enzymes involved in breaking down nitrogen-containing molecules such as proteins. Release of nitrogen from the living and non-living organic material in the soil is called mineralization.
It is evident that soil ‘micro-animals’ affect plant growth. In controlled environment studies, plants grown in soil with both microbes and protozoa were able to take up 40-75% more nitrogen than plants grown in soil without the protozoa. Unfortunately, it is difficult to quantify the contribution of the ‘micro-animals’ to mineralization of nitrogen even when their population is known. Even without protozoa and nematodes, nitrogen in the microbial cells is gradually released as energy sources are depleted and microbes die.
Fig 17. Microscopic creatures of the underworld: application of manure and fertilizer produce different effects on populations of soil microbes.
A study at PARC (Agassiz) compared the effects of repeated applications of manure and fertilizer on soil microorganisms under a grass stand. Immediately after the manure was applied, bacteria populations doubled (see Fig. 17). The bacterial growth probably stimulated the short-lived peak of protozoa. The repeated manured plots sustained high populations of bacteria-eating nematodes.
In contrast to manure, nitrogen fertilizer slightly depressed bacteria populations and had no effect on nematodes. In fact, populations of bacteria-feeding nematodes and protozoa were several times greater in manured than in fertilized plots. Interestingly, both manure and fertilizer reduced soil fungi compared to the control.
This study shows that applying manure causes massive unseen changes in soil microbes. The rising bacteria population captures some of the nitrogen that would be available to plants, immobilizing this nitrogen. But the surge of protozoa and the resident populations of bacteria-eating nematodes help to release (mineralize) some of the nitrogen back into the soil. Soils with a history of manure application have a more dynamic response to addition of nutrients than soils that receive only fertilizer. Understanding soil microbes is necessary to predict the fate of nitrogen and other nutrients in the soil.
Contributed by Tom Forge, Lakehill Applied Soil Ecology, Kaledan, BC.
Dairy farmers in the region submit plant and soil samples for analysis to feed and fertilizer companies and to private laboratories. Analytical procedures vary among laboratories so results are not always comparable. Some laboratories base fertility recommendations on outdated models that do not adequately credit the nutrients in manure or other organic soil amendments. Make sure that the laboratory you are using is current and uses local research to develop its recommendations.
Farmers now have the option of using on-farm quick-tests to do some analyses. On farm kits have several advantages:
Testing is inexpensive. Once the test kit is paid for, each analysis costs much less than a laboratory. Also, the inconvenience and cost of shipping samples is avoided.
Quick results. Results are available within minutes or hours of collecting the sample, depending on the test kit. Commercial laboratories typically have at least 2 – 3 day turnarounds, plus shipping time. Conditions during transportation may affect results.
Accuracy. Some of the test kits now available for soil, plant and manure analysis can produce very accurate results.
Note that because grassland systems are fertilized and manured frequently, an inexpensive reliable quick-test is especially handy for fine-tuning rate of application.
Quick-tests also have some drawbacks:
Consistent results. To get accurate results, the operator must use precise and consistent techniques. When testing samples only 3 or 4 times a year, it can be difficult to maintain identical technique each time.
Complicated procedures. Some test kits require that the user have considerable skill to meticulously follow instructions. While some quick-test kits have proven results under controlled conditions, they may be less effective in on-farm situations. Interpreting the results. Knowing soil nutrient content is of no use unless the results can be used to guide rates of nutrient application. Test kits should be furnished with an interpretation based on local research.
Verification necessary. It is generally recommended that duplicate samples should be periodically sent to a commercial laboratory to verify the performance of the kit.
1. The Nova MKII nitrogen meter from Sweden provides a value for the ammonium-N concentration in manure. This test takes less than 10 minutes to complete and is generally accurate to within 10% of laboratory values. (Available from Grass Roots Project Management, PO Box 136, Chilliwack, BC, V2P 6H7)

Fig 22. Nova MKII meter measures ammonium-nitrogen concentration in manure.
A measured volume of manure is mixed with a chemical reagent in a sealed container. The reaction releases nitrogen gas, creating pressure in the chamber. A pressure gauge is calibrated to give the ammonium-N concentration in the manure. Where manure application rates are based on ammonium-N, this test kit is adequate.
2.The hydrometer is a cheap and simple tool used to estimate total solids content of manure. (Available from Whatcom Conservation District, 6975 Hannegan Rd., Lynden, WA, 98264)
The hydrometer consists of a glass cylinder with a weighted bottom. It is placed in a bucket of well-mixed manure and allowed to float for 15 sec. Very thick slurry may need to first be diluted. The solids content can be read directly. Calibration charts are used to correlate the solids with nitrogen and phosphorus content. Considering the benefits of diluting thick slurries on crop response (see Fig 7 and 8), the hydrometer is useful for determining how much water to add to reach a desired solids content.
Soil Quick-Test Kits
1. ‘NITRACHEK’ Reflectometer. This field kit rapidly tests both available ammonium and nitrate content in soil in about one hour. The procedure involves reading paper test strips with a reflectometer. Nutrients are extracted from undried soil with a potassium chloride solution. Adjustments for soil water content are made by means of a standard dilution procedure. This test gives very accurate results, typically within 5% of laboratory values.
2. Nitrate Quick Test. This kit tests only for nitrate-nitrogen and requires that soil samples first be dried at room temperature. Nitrate Quick Test has been found reliable and accurate for Fraser Valley soils with the following qualifiers:
-Nitrate should be extracted with aluminum sulphate rather than potassium chloride. -For soils with low nitrate concentration, a lower dilution should be used (i.e. 2:1 rather than 10:1)
(Hawk Creek Laboratory, Inc. Box 386, Glen Rock PA, 17327)
3. Cardy Meter. This procedure tests for nitrate in soil after air-drying. The dry soil is mixed with an extracting solution and filtered. A few drops of filtered extract are placed on the hand-held nitrate ion meter. Nitrate readings are in parts per million. The bulk density of the soil must be known or estimated to convert to kg/ha (or lb/ac) of nitrate-nitrogen. While not quite as accurate as the Nitrate Quick-Test, the Cardy meter is very simple to use. (Spectrum Technologies, Inc.)
4. N-Trak. The N-Trak test kit is promoted by Iowa State University and used widely in the Midwestern U.S. Soil extract is treated with cadmium and produces a colour reaction depending on nitrate concentration. Nitrate concentration is determined by matching the treated extract with colour chips. This test kit requires subjective colour assessment. Safe disposal of the cadmium reagent must be attended to. The N-Trak is also fairly easy to use.
Crop Indicators
Silage or hay samples are often analyzed for nutritional quality to develop balanced rations for livestock. The crude protein and nitrate information can also be used to assess fertility practices. High protein levels (over 18%) result from short cutting intervals but also suggest very high rates of nitrogen application. High nitrate levels (over 0.1% nitrate-nitrogen) in tissue indicate a possible health hazard for livestock but also suggest excessive application of nitrogen from manure or fertilizer. In general, crude protein levels of 16-18% with nitrate-nitrogen below 0.05% suggest sound nitrogen management, although factors such as variety of grass, stage of growth, weather conditions and time of year need to be taken into account.
A new hand-held instrument called ‘SPAD meter’ (Minolta Ltd.) is being used in the field to detect nitrogen deficiency in several crops including corn and tobacco. The instrument clips onto a leaf and gives an instant measurement of leaf colour. It detects slight differences in leaf greenness, which is greatly influenced by nitrogen status, although other factors (variety, sulphur, drought, etc) are also involved. This instrument holds promise for use on grass.
Finally, crop response to applied nutrients can be directly evaluated with test strips in the field. Applying more or less fertilizer to strips in a field for comparison is an excellent way to assess the benefit or need for fertilizer. It may be possible to use ‘pasture probes’ to detect differences in production among the test strips that would go unnoticed visually.
The Value of Manure Analysis and Record-Keeping
Because there is no reliable soil nitrogen test for forage production in this region, producers are encouraged to use the best alternative approach to nitrogen management: establishing a proper record-keeping system. Over time, the records tell a story – they become a report card that shows how well nitrogen and other nutrients are being managed on the farm. Year-to-year variation in weather conditions causes short-term fluctuations in values for the various records, but after three or more years of record keeping, farm trends will emerge. Proper records of nutrient management should contain the following information:
- Soil test results
- Fertilizer applications – time, rate and analysis
- Manure applications – time, rate and manure analysis
- Forage yields (preferably on a dry matter basis)
- Forage analysis (crude protein, potassium, ADF, NDF, moisture)
Large differences in farming operations mean a wide range of nutrient concentrations in manure. Seasonal variation in manure nutrients occurs within farms, particularly those using uncovered storage. Consequently, manure analysis is always recommended. In the first year or two, have the manure analyzed 3-5 times during the growing season. If overall management remains constant and manure analysis results remain consistent from year to year, the frequency of analysis can be reduced.
A computerized system for keeping nutrient records was developed by D. Grusenmeyer and T.N. Cramer of Washington State University Cooperative Extension, Bellingham, WA. Computer diskettes are available from WSU without cost.
Sulphur
Sulphur is an essential nutrient for both plants and animals. Many compounds in plants and animals contain sulphur, but most important are the sulphur-containing amino acids (i.e., methionine, cystine and cysteine). Since amino acids also contain nitrogen, there is a close association between nitrogen and sulphur content in both plants and animals. The ratio of N:S in plants and animals is approximately 15:1, varying more widely in plants than in animals. Plant sulphur concentrations typically range from 0.15 – 0.30%. A 13 tonne/ha (6.0 ton/ac) grass crop takes up about 20 kg/ha (18 lb/ac) of sulphur compared to 250-400 kg/ha (225-360lb/ac) of nitrogen and 45 kg /ha (40 lb/ac) of phosphorus.
Sulphur in Soils of Southern BC and the Pacific Northwest
Total sulphur content of the surface horizon of soils ranges a thousand-fold (50-50,000 ppm or 0.005-5%). The organic form makes up 90-98% of the sulphur in the surface horizon of most agricultural soils. The most abundant inorganic form of sulphur in well-aerated soils is sulphate. Most sulphate, especially in acid soils, is bound or adsorbed to the mineral fraction of the soil while some sulphate is dissolved in soil water. Plants take up sulphur more readily in the inorganic sulphate than organic sulphur form.
Responses by forage crops to applications of sulphur have been documented from the humid to the arid regions of the Pacific Northwest. In the lower Fraser Valley, responses of forages to sulphur application have varied from substantial increase in yield to no effect; in one study yield actually decreased. Spring and fall harvests tend to respond more than those in mid-summer. Response is usually greater by legumes than grasses, so sulphur applications can help to maintain clover in mixed stands.
Soil Testing for Sulphur
Although commercial laboratories routinely analyze soil for sulphur, the effectiveness of the tests is not known. The chemical solutions for extracting available sulphur have not been standardized, adding to the difficulty of comparing and interpreting the results.
Soil testing solutions generally extract most of both organic and inorganic sulphur fractions and no allowance is made that plants take up sulphur more readily as inorganic sulphate. Also, soil tests cannot make allowance for the mineralization of organic sulphur to sulphate by microbes during the growing season.
Fertilizing with Sulphur
It is tempting to regularly apply sulphur fertilizer as an “insurance” for maximum yield because the soil test is uncertain and because sulphur fertilizer is inexpensive. Sulphur can be easily included in fertilizer blends, especially with certain nitrogen, phosphorus, potassium and magnesium fertilizer formulations. Recommended application rates for sulphur in British Columbia are modest, ranging from 10 – 35 kg/ha (9-32 lb/ac).
However, there are some detrimental consequences (besides the extra cost) to applying sulphur in excess of plant requirements. Most sulphur fertilizers acidify the soil so additional lime is required to counteract this effect. In some cases, reduced yields have resulted from even low rates of sulphur application. Finally, sulphur is known to reduce the uptake of other nutrients. For example, sulphur and selenium behave quite similarly in the soil, and sulphur applications have been shown to reduce selenium concentration of forages. This could exacerbate situations where low selenium in feed is already a livestock health problem (see Pg. 51). Sulphur may also contribute to an imbalance of copper and molybdenum in ruminants.
There are numerous options for adding sulphur as commercial fertilizer. The least costly source is ‘elemental sulphur’ which contains 95-99% sulphur. Unfortunately, elemental sulphur is unavailable to crops until it is oxidized to sulphate by soil microorganisms. Oxidation rates vary greatly among soils. As there is little information on oxidation rates for coastal soils, it is best to consider elemental sulphur as a “slow-release” form of fertilizer.
Some primary fertilizers contain sulphur in the available sulphate form. For example, some nitrogen fertilizers (e.g. 16-20-0 and 21-0-0) contain substantial proportions of sulphur while the formulation 34-0-0 can contain either substantial sulphur (sulphur coated urea) or almost none (ammonium nitrate). Phosphorus fertilizers such as 0-18-0 and 0-46-0 can contain up to 12% sulphur, depending on their geological source and degree of refinement during manufacturing. The potassium fertilizer 0-0-50 contains about 18% sulphur. The fertilizer called ‘SulPoMag’ (sulphate of potash-magnesia) is a popular source of magnesium that contains about 22% sulphur. The lime source, gypsum (calcium sulphate), contains 16% sulphur.
All organic wastes, including manure, contain some sulphur primarily in the organic form. Four years of manure application has significantly increased sulphur level in the surface horizon at PARC (Agassiz). There is little information on the availability of sulphur from organic sources but it is assumed that they would be more slowly available than inorganic sulphate.
It should be remembered that sulphur from atmospheric pollution is deposited on soils via precipitation. The amount of deposition depends on the amount of industrial activity, especially the amount and quality of coal that is being burned. As pollution is reduced, more sulphur fertilizer is needed. A few measurements taken at PARC (Agassiz) showed low sulphur concentrations in rainwater so that the annual contribution from rain would be only about 5 kg /ha (4.5 lb/ac). Sea spray contributes sulphur within a few kilometres of the ocean. Sulphur may also be present in irrigation water.
-‘Sulphur’ contributed by C.G.Kowalenko, PARC (Agassiz)
Table12. Function and requirements of micro-nutrients by forage in BC and the PNW
| Micro-Nutrient | Plant Function | Requirement |
| Aluminum | Toxic to plants | Aluminum is a trace mineral that reduces crop growth by either accumulating in toxic quantities in the plant or by influencing other nutrients. Research has shown that aluminum toxicity occurs on acid soils in south-coastal BC Liming effectively reduces availability of aluminum. |
| Boron | Function in plants is not well understood. Deficiency shows up as failure of root tips to elongate normally Cell division in shoot apex is also inhibited. | Boron deficiency is widely reported in south-coastal BC Considerable work on plant tissue analysis has been conducted but results are not conclusive enough to develop reliable recommendations. Soil testing appears to be the best method for predicting boron fertilizer requirements but there is a shortage of field data to interpret soil test results. Grasses are classified as having low boron requirements relative to other plants. There is a tendency for manure to increase soil boron. |
| Chlorine | Stimulates the splitting of water during photosynthesis; also essential for roots and cell division in leaves. Leaf deficiency symptoms consist of reduced growth, wilting and development of chlorotic or necrotic spots. | Research is insufficient to draw conclusions about the chlorine status of BC soils. Chlorine concentrations are generally high near salt water and lower further inland. Chlorine has been shown to enhance disease resistance in plants. |
| Cobalt | Not required for plants. | Cobalt has not been examined extensively in BC soils. Animal deficiencies can be easily treated with mineral supplements. |
| Copper | Copper is present in several enzymes or proteins involved in oxidation and reduction processes. In deficient plants, young leaves often become dark green and twisted or otherwise mis-shapen. | Plant and soil analyses indicate variable levels of copper in south-coastal BC, ranging from deficient to adequate. The relationship of these analyses to crop growth has not been clearly defined for this region. In one greenhouse study, copper application to forage did not increase yield but did rise copper concentrations in plant tissue. Often the supply of copper is adequate for plant but not livestock needs so copper has to be given to livestock. |
| Iron | Required in fundamental electron transport processes. Deficiency shows up as chlorosis between the veins of youngest leaves. | Iron is not generally limiting in forages in south-coastal BC. Availability of iron decreases with increasing pH. Little research has been directed at developing methods for predicting iron deficiency or solving problems if they occur . |
| Manganese | Plays a structural role in the chloroplast membranes; also involved in the photosynthetic reaction that splits water . Deficiency appears as chlorosis between veins of young and old leaves and necrotic lesions. | Both deficient and toxic soil conditions exist in south-coastal BC. Manganese requirements are influenced by crop, soil and weather conditions. Manganese availability decreases as pH increases so manganese fertilizer recommendations must take into account pH. Manure tends to decrease available manganese. |
| Molybdenum | Function in plants is not well understood – part of the enzyme “Onitrate reductase” that reduces nitrate to nitrite. Deficiency appears as chlorosis between veins of first (oldest) leaves and progressing to youngest. | Research in south-coastal BC has been insufficient to determine whether molybdenum is adequate for general crop yield and crop quality for animal production. Molybdenum interferes with copper metabolism in cows . |
| Selenium | Not required. | It is well-established that forages in coastal BC have inadequate selenium for livestock needs. Research at PARC (Agassiz) has demonstrated the possibility of using a slow-release selenium fertilizer to supplement forages (see below). |
| Zinc | Required to produce the hormone indoleacetic acid that regulates growth. Also contained in many enzymes. Deficient plants show reduction of growth in young leaves and stems. | Response to zinc fertilization in BC has been variable. The availability of zinc decreases as pH increases so fertilizer recommendations must take into account management practices, particularly liming, that alter pH . Zinc toxicity may occur on acidic soils or from excessive zinc applications. Zinc is generally low in animal feeds in BC but low levels have not impacted reproduction or overall performance of animals. Manure application tends to increase available soil zinc. |
| (Summarized from Kowalenko, C.G. and Neilsen, G. 1992. Assessment of the need for micronutrient applications for agricultural crop production in British Columbia. Agriculture and Agri-Food Canada Technical Publication.) | ||
| Effect Of Dairy Manure On Soil Attributes | |
| Soil Character | Effect Of Manure |
| Calcium | Increase |
| Potassium | Increase |
| Magnesium | Increase |
| Phosphorus | Increase |
| Sodium | Increase |
| Sulphur | Increase |
| Copper | Slight increase |
| Iron | Slight decrease |
| Manganese | Decrease |
| Zinc | Increase |
| Boron | Slight increase |
| Conductivity | Increase |
| pH | Increase (compared to fertlizer) |
Micronutrients
Micronutrient requirements of forages have been studied sporadically for many years in BC and the PNW. Use of micronutrient fertilizers has generally increased over the years. Micronutrient deficiencies may affect plant growth or animal performance. Certain micronutrients (copper, zinc, manganese, iron and molybdenum) are required in greater concentration by animals than by plants while others (cobalt and selenium) are required by animals but not by plants. Table 12 summarizes the current state of understanding of micronutrient needs for forages in coastal BC and the PNW. Adding Lime
Soil acidity often reduces pasture production in coastal BC and the PNW. Acidity of soils can be reduced by spreading lime. Lime applied to the soil surface of long-term grass stands does not readily soak into the soil. Instead, mixing of lime through the soil profile is accomplished by the soil-dwelling organisms, particularly earthworms.
A recent trial investigated the rate of mixing of surface-applied lime and effect on crop response in four orchardgrass and ryegrass pastures in western Oregon. Lime was applied in the fall of 1993 at 0, 2.5 or 5 t/ha (0, 1.1 and 2.2 ton/ac). In 1994, no effects were detected on production, plant nutrient content, lime mixing or soil nutrient content. By 1995, two of the four sites displayed increased soil pH and calcium levels to a depth of 10 cm (4 in) while the other two sites had mixing to 5 cm (2 in).
Lime increased production in two pastures by 0.5 t/ha and 1.7 t/ha (0.3 and 0.9 ton/ac). In one of these pastures, the lime was mixed to only 5 cm (2 in) depth, suggesting that shallow mixing may be adequate to stimulate production.
The same factors that regulate earthworm activity also regulate lime movement: temperature, moisture and soil textural class. The depth to which lime mixing occurs is the depth to which soil acidity (pH) is affected.
Soil pH affects the availability of several nutrients. Listed below are some of the benefits of liming on nutrient availability and soil properties:
- Lime increases phosphorus availability by reducing solubility of aluminum and iron. In acid soils, aluminum and iron dissolve somewhat and bind to phosphorus in solution, making it unavailable.
- Lime increases nitrogen and organic matter by creating a more hospitable environment for soil fauna (i.e. earthworms) and microbes, which results in greater decomposition of soil organic matter and higher rates of nitrogen mineralization. Lime particularly favours the conversion of ammonia to nitrate (nitrification).
- Lime reduces levels of soluble aluminum that may be phytotoxic.
- Lime reduces manganese levels that may be phytotoxic.
In the Oregon study, liming increased production by stimulating mineralization and nitrification. Lime increased uptake of nitrogen by grasses in the two responsive sites by 55 and 85 kg/ha (50 and80 lb/ac). Both pastures had received 125 kg/ha (110 lb/ac) of inorganic nitrogen fertilizer.
The responsive sites contained higher organic matter in their surface layer (2.5 cm or 1 inch deep) than the unresponsive sites. The organic matter is a source of nitrogen for mineralization/nitrification which can lead to increased production. However, high organic matter may also indicate a thatch buildup due to acidity. Thatch may reduce uptake of nitrogen fertilizer due to a high C:N ratio and perhaps due to its effect on plant root distribution.
-‘Adding Lime’ based on J. Rogers, 1995. “Effect of top-dressed lime upon pasture production and quality,” M.Sc. Thesis (Oregon State University).
Nitrates in Forage
Where do nitrates come from? Plants can absorb nitrogen from the soil in only two forms, nitrate and ammonium. Ammonium in the soil, originating from manure, fertilizer or soil organic matter, is easily converted to nitrate by specialized bacteria (see ‘Nutrient Cycle,’ Pg. 24).
Nitrate moves freely in the soil but in cold soils, forages take up more ammonium than nitrate. High levels of ammonium can actually be toxic to plants but ammonium is rapidly converted to amino acids in leaves. In contrast, nitrate is first converted to ammonium, which is then assimilated into proteins.
Research at PARC (Agassiz) has shown that more than 10% of plant nitrogen can be in the nitrate form, although in extreme cases values of 50% have been reported. Rapidly growing leaves require 0.05-0.15% nitrate-nitrogen so concentrations in the entire plant greater than 0.1% indicates that excessive nitrogen has been supplied.
Factors causing nitrate accumulation
Conversion of nitrate to ammonium involves removing oxygen atoms. The process is called reduction, which is the opposite of oxidation. This reaction is very energy demanding, consuming half of all the energy used by plants for growth.
Fig 23. Relationship between crude protein and nitrate-nitrogen in four harvests in coastal BC.
Nitrates accumulate in plants when the rate of uptake is greater than the rate of reduction to ammonium. The rate of reduction is limited by the amount of energy available from photosynthesis.
Factors that restrict photosynthesis more than uptake of nitrate cause nitrate accumulation. Defoliation obviously reduces photosynthesis, so initial regrowth after harvest is typically high in nitrate. Maximum nitrate concentrations typically occur about two weeks after application of fertilizer, depending on environmental conditions. Therefore, delaying application of fertilizer or manure tends to increase nitrate at harvest. Nitrates are highest in grasses harvested before the heading stage.
Low light levels also increase nitrate levels. It has been suggested that grass suspected of having high levels of nitrate be harvested in late afternoon to reduce concentrations. Low temperatures reduce uptake more than photosynthesis, hence decrease nitrate. Sudden drought under high summer temperatures, or sudden frost, can cause plants to accumulate dangerously high levels of nitrate.
Fig 24. Effect of applying 400 kg/ha (360 lb/ac) of nitrogen fertilizer on nitrate levels in forage grasses. The fertilizer was applied in different seasonal distribution patterns.
Forages differ in their tendency to accumulate nitrate. Nitrate accumulators include orchardgrass, tall fescue, many broadleaf weeds and annual crops such as Italian ryegrass, sorghum-sudangrass, fodder rape, cereals other than wheat and root crops such as beets. Other grasses, such as smooth bromegrass, timothy and perennial ryegrass, have a lesser tendency to accumulate nitrate. Legume crops accumulate least nitrate because they assimilate protein in the roots rather than leaves.
Studies at PARC (Agassiz) have shown that the tendency to accumulate nitrate in grasses varies with the season. In spring and autumn, crude protein reaches 16% with safe levels of nitrate, but in summer dangerous levels are reached below 15% crude protein (Fig. 23). Producers often strive for protein levels well above 16%. Perhaps nitrate levels above 1700 ppm (0.17%) can be taken as a report-card indication of excessive nitrogen application.
Table 13: Critical nitrate-toxicity levels to cattle as affected by crop usage.
| Nitrate-N Concentration |
Feed Class |
| Safe for all forages | |
| >0.17% | Potentially toxic as conserved forage |
| >0.34% | Potentially toxic as green-feed |
| >0.45% | Potentially toxic to grazing cattle. |
With uniform applications of 100 kg/ha (90 lb/ac) of nitrogen for each harvest, nitrate levels stay near the hazard line (Fig. 24). Applying most of the fertilizer in the spring increases the nitrate risk for the first and second harvests. Note that after heavy spring applications of nitrogen, the risk of high nitrate persists late into the season, probably because the nitrogen is temporarily immobilized by soil organisms.
Effect of high nitrate
Nitrate, unlike ammonium, is not toxic to plants. However in animals, nitrate is converted to nitrite, which interferes with the ability of the blood to transport oxygen, causing reduced blood pressure, heartbeat and respiration. In acute cases, livestock may die very quickly following the consumption of high-nitrate feed. Chronic exposure to high levels of nitrate may interfere with vitamin A and iodine metabolism causing reduced milk production and higher incidence of abortion.
The toxicity level for nitrates differs with the source of feed because the rate of nitrate release varies (Table 13).
Tips to Minimize Risk of Nitrate Poisoning
(Based on G Smith, 1990, Dairy Producers Short Course) |
Potassium – Too much can really stun your dry cows!
A high level of soil potassium can have a serious impact on health of cattle. Grasses and alfalfa are luxury consumers of potassium, meaning that the more potassium in the soil, the higher the concentration in the plants.
Excess potassium in the diet (over 3.5%) reduces absorption of calcium and magnesium in the digestive tract of cows. High concentrations of potassium relative to calcium and magnesium in the feed cause a wide array of metabolic disorders such as milk fever, calving problems and displaced abomasums.
Dry cows are most susceptible to high potassium and, to make matters worse, these cows are usually fed the greatest amount of home-grown forage. Although lactating cows are less sensitive, research at PARC (Agassiz) found that cows fed forage with 4.6% potassium had higher water intake and triple the urine output of cows fed forage with 1.6% potassium. High urine output indicates that the kidneys are working overtime and that could have long-term implications for the health of the cow.
Table 14: Content of potassium, magnesium, and calcium in forage grasses.
| (Mg) Magnesium |
(K) Potassium |
(Ca) Calcium |
Mg/K | Mg/(K+Ca) | |
| Tall fescue | 0.35 | 2.67 | 0.58 | 0.130 | 0.107 |
| Meadow fescue | 0.27 | 2.75 | 0.70 | 0.099 | 0.079 |
| Orchardgrass | 0.23 | 2.95 | 0.57 | 0.079 | 0.066 |
| Perennial ryegrass | 0.19 | 3.21 | 0.67 | 0.060 | 0.050 |
What to do about high potassium in forage?
Potassium builds up in soils of high-density livestock farms because the quantity of potassium coming onto the farm, mostly in feed, exceeds the quantity leaving the farm in milk and meat. There is no easy way to circumvent potassium accumulation, but several management steps are available to minimize the harmful effects:
I. REDUCE POTASSIUM CONTENT IN FORAGES
- Reduce potassium fertilizer application and eliminate off-farm manure sources.
- Set aside a specific field (5-10% of land-base) for feeding dry cows. This field should receive mostly mineral fertilizer (no K) and little manure. Over time, the forage grown on that field should decline in potassium. In a recent study at PARC (Agassiz), soil potassium levels in a tall fescue stand dropped by 45% (88 ppm) after 3 years of fertilizer application (high rates of nitrogen and moderate rates of phosphorus and potassium). In contrast, soil potassium increased dramatically in areas receiving high rates of manure for 3 years.Note that a large crop removes more potassium from the soil than a small crop and that potassium concentration is more dilute in heavy forage crops.
- Dilute high potassium forages with low potassium feeds. Warm-season grasses (e.g. corn) usually have lower potassium levels. Corn stalks are especially low in potassium. Purchased forages and commodities (i.e. cottonseed, brewers grain) obtained from non-livestock farms are usually low in potassium.
Note that increasing purchased feed will add to the potassium loading on the farm unless the manure is exported off the farm.
II. ENHANCE MAGNESIUM CONTENT
- Use grasses that are naturally high in magnesium (high Mg/(Ca+K)) such as tall fescue (see Table 14) for feeding dry cows.
- Look for new varieties that may be released in the future with improved balance of magnesium to potassium plus calcium. Unfortunately, there is little likelihood of new varieties that can exclude potassium.
- Fertilize with magnesium oxide or dolomitic limestone. Tall fescue removes the most magnesium hence requires the greatest supplement. Avoid SulPoMag fertilizer because of the potassium content.
- Consider adding magnesium oxide and anionic salts to the diet of close-up cows. Unfortunately, these additives are not very palatable and developing an appropriate diet is difficult.
| Table 15: How to determine if your farm is deficient in Selenium. | |||
| Test | Deficient | Marginal | Adequate |
| Soil | Less than 300 ppb | 300-500 ppb | More than 500 ppb |
| Plant | Less than 100 ppb | 100-200 ppb | More than 200 ppb |
| Whole Blood | Less than 10 ppb | 10-20 ppb | More than 20 ppb |
Selenium ‘Fertilizer’
Livestock fed crops grown on selenium-deficient soils, such as in coastal BC and the PNW, must be provided with this essential trace nutrient. Symptoms of selenium deficiency include white muscle disease, infertility and poor growth. Selenium is currently administered to ruminants in feed supplements, mineral licks or by injections, but these methods are expensive or difficult to manage. Applying selenium as a fertilizer to raise the level in the grass is widely practised on New Zealand pasture land.
Fig 25. Slow-release selenium (Selcote Ultra) enhances selenium in forages for an entire year at PARC (Agassiz). (Note: 10 g/ha is equal to 0.02 lb/ac).
Selenium is difficult to apply as a fertilizer because the rates required are extremely low. Soluble selenium can be applied with pesticide sprayers but the effectiveness is short-lived. In New Zealand, farmers are using a new slow-release selenium product called Selcote Ultra. This prilled product can be blended with other fertilizers to facilitate application. Research at PARC (Agassiz) showed that just 10 g/ha (0.02 lb/ac) of selenium (as Selcote Ultra) applied in spring raised levels of selenium in the forage for an entire year. In contrast, soluble selenium was ineffective after a few months (Fig. 25).
Producers should check with suppliers for availability and regulations regarding use of any selenium fertilizer. Treated forage should always be monitored.